Our system will evaluate the answer based on this AI-generated description.
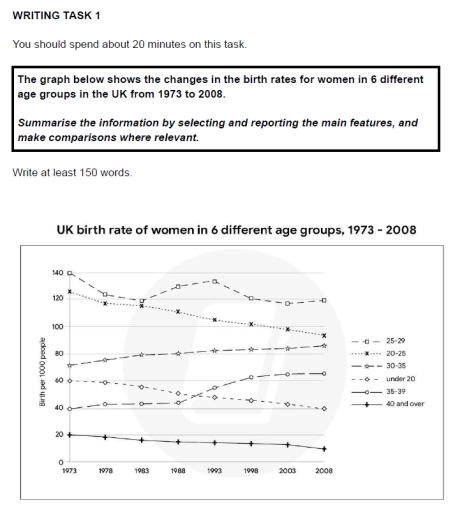
The image depicts UK women's birth rates from 1973 to 2008 in age groups: 25-29, 20-24, 30-35, under 20, 35-39, and 40 and over. In 1973, 25-29 had 140, 20-24 had 130, 30-35 had around 65, under 20 had 50, 35-39 had 25, and 40 and over had about 5. In 1978, 25-29 was 125, 20-24 was 100, 30-35 was 57, under 20 was 45, 35-39 was 25, 40 and over was about 5. By 1983, 25-29 was 110, 20-24 was 90, 30-35 was 60, under 20 was about 45, 35-39 was 25, 40 and over was around 5. In 1988, 25-29 was 115, 20-24 was 85, 30-35 was 60, under 20 was about 45, 35-39 was 25, 40 and over was around 6. By 1993, 25-29 was 112, 20-24 was 65, 30-35 was about 57, under 20 was 42, 35-39 was 25, 40 and over was around 8. In 1998, 25-29 was 100, 20-24 was 55, 30-35 was about 55, under 20 was 42, 35-39 was 30, and 40 and over was 10. By 2003, 25-29 was 102, 20-24 was about 55, 30-35 was 66, under 20 was 41, 35-39 was 40, 40 and over was about 12. In 2008, 25-29 was 98, 20-24 was 52, 30-35 was 95, under 20 was 40, 35-39 was 45, 40 and over was 16.
Given the complexity of the image, the above description may not be entirely accurate.
Skyrocket your IELTS band score by 1-2 points in under a month with our premium plan!
Note: Both the topic and the answer were created by one of our users.
The graph represents how much the share of birth per 1000 people for women changed in a variety of age groups in the UK between 1973 and 2008.
Overall, it can be seen that the birth rate in most age groups witnessed a downward trend throughout the period of time. Meanwhile, age groups like 30-35and 35-39 underwent moderate increases from 1973 to 2008.
When it comes to the figure for 25-29 age group was by far the highest number of birth rates, it experienced significant decreasing from 140 to 120 in one decade afterwards it go up to about 135 a birth per 1000 people in 1993, however, between 1993 and 2008 25-29 age group declined but still ranked first across the board. Regarding figures for 20-25 and under 20 age groups both showed noticeable decline, the former from approximately 125 to 90 taking the second place and the latter from 60 in 1973 to 40 in the final year.
As for the other figures that represented the steady rise, the share of birth for a group of 30-35 aged people showed an upward trend, being initially 70 and making 85 in 2008. Similarly, the figure for the older group remained unchanged around 40 until 1988 after dramatically rising to 65 in 2008. Finally turning to the oldest group that decreased two fold from 20 to about 10 a birth per 1000 people in the final year.
Word Count: 237
