Our system will evaluate the answer based on this AI-generated description.
The image contains a line graph tracking consumption of chicken, beef, lamb, and fish in grams per person per week from 1979 to 2004. Chicken starts at around 150g, dips to just below 150g in 1985, then rises sharply to almost 250g in 1990 before leveling off and ending just below 250g. Beef begins just over 200g, oscillating slightly but steadily decreases to slightly over 100g by 2004. Lamb starts at approximately 150g, gradually declining to around 50g in 1999 and remains steady till 2004. Fish consumption starts at about 50g, slightly increases and fluctuates around 60g, with a small spike to around 80g in 1989, and descends to below the starting point, ending just under 50g. The graph's Y-axis is labeled "Grams per person per week" and spans from 0 to 300, while the X-axis represents years from 1979 to 2004 at five-year intervals.
Given the complexity of the image, the above description may not be entirely accurate.
Skyrocket your IELTS band score by 1-2 points in under a month with our premium plan!
Note: Both the topic and the answer were created by one of our users.
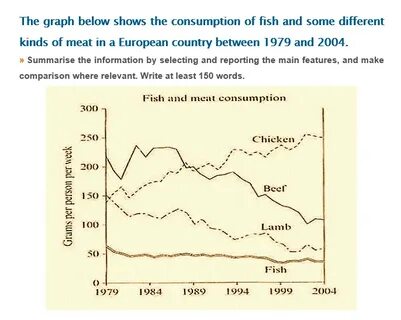
The line graph compares the intake of fish and various types of meat in European country from 1979 to 2004.
Overall,the chicken reached the highest level of consumption,however beef and lamb saw a decrease over the two decades.Moreover,the fish percentage remained fairly stable.
in 1979,the beef had high consumption ,with 230 grams for person.The fish selling was the lowest one,showing only over 50.After that,the lamb and chicken were sold by 150 and slightly fewer grams.Although chicken was produced barely 150 grams in 1979,then it showed a huge rise in intake over the next 15 years.
Meanwhile,beef selling fell to 100 grams in 2004,going from the most to the one of the least percentage of consumption.The lamb’s figure declined as beef’s,to the approximately 60,while the fish saw a little deviation around 50 grams annually.
Word Count: 133