🔥 Today Only: Save 30% on Premium — Offer Ends Soon! - Upgrade Now!
Bar Chart

Band 6+: The graph below shows the contribution of three sectors, agriculture manufacturing and business and financial services to the UK economy in the twentieth century.summarizing information by selecting and reporting the main features and make a comparisons were relevant.

Image for topic: The graph below shows the contribution of three sectors, agriculture manufacturing and business and financial services to the UK economy in the twentieth century.summarizing information by selecting and reporting the main features and make a comparisons were relevant.
Our system will evaluate the answer based on this AI-generated description.
The image depicts a bar graph representing the contribution of selected sectors to the UK economy in the twentieth century, with data points in 1900, 1950, 1975, and 2000. The graph shows three sectors: Agriculture (in blue), Manufacturing (in green), and Business and Financial (in purple). In 1900, Agriculture contributed approximately 10%, Manufacturing 50%, and Business and Financial 40%. In 1950, the contributions were approximately 5% for Agriculture, 45% for Manufacturing, and 50% for Business and Financial. By 1975, Agriculture's contribution decreased to around 2%, while Manufacturing and Business and Financial had contributions of roughly 35% and 63% respectively. In 2000, Agriculture's contribution was negligible at less than 5%, Manufacturing decreased further to around 25%, and Business and Financial increased to around 70%.
Given the complexity of the image, the above description may not be entirely accurate.
Note: Both the topic and the answer were created by one of our users.

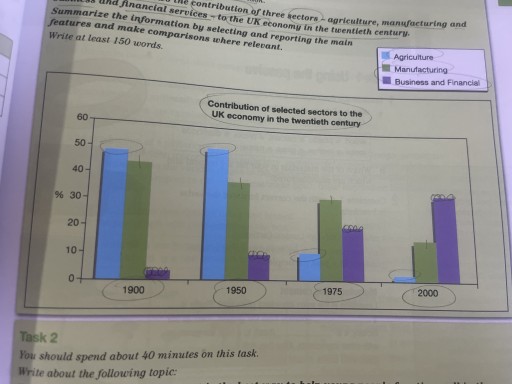
The graph illustrates how the contribution of agriculture, manufacturing, and business and financial services to the UK economy changed over the 20th century.

Overall, it can be seen that the agriculture and manufacturing saw a stable decrease during the entire period, whilst the business and financial witnessed a noticeable rise.

Agriculture accounted for almost 50% in both years and it was in the leading position (in 1900 and 1950). However, after 1950 it dropped dramatically and fell from 50% to around 10% in the final years in 1976 and 2000. By contrast, the contribution of business and financial services experienced a steady growth. To be exact, it was the least common type of service with only 10% in 1950 before witnessing a stable rise from around 20% in 1975 to about 30% in 2000.

Manufacturing, on the other hand, made up around 40% in the years 1900 and 1950, before experiencing a moderately decline from about 40% in 1975 to approximately 20% in 2000.

Word Count: 164

Answers On The Same Topic:

The graph below shows the contribution of three sectors, agriculture manufacturing and business and financial services to the UK economy in the twentieth century.summarizing information by selecting and reporting the main features and make a comparisons were relevant.

At first,we look at the contribution of agriculture in 1900.it is placed a bit lower than 50%.To 1950 it rose to above 50%. Then it was getting lower,In 1975 it hit a little more than 10% and to 2000 it hit almost 0%. As we look to the manufacturing sector,we can say,that it was getting […]

The graph below shows the contribution of three sectors, agriculture manufacturing and business and financial services to the UK economy in the twentieth century.summarizing information by selecting and reporting the main features and make a comparisons were relevant.

The diagram provides a supplement of three economic fields of the UK in the twentieth century, including agriculture, manufacturing, and business and financial services. Overall, the contribution of the trio showed some fluctuation from 1900 to 2000; each of them had general upward and downward trends. In the period between 1900 and 1950, agriculture occupied […]

The graph below shows the contribution of three sectors, agriculture manufacturing and business and financial services to the UK economy in the twentieth century.summarizing information by selecting and reporting the main features and make a comparisons were relevant.

The graph illustrates how the contributions of agriculture, manufacturing, and business and financial services to the UK economy changed over the 20th century. Overall, the financial and business sector saw a remarkable rise, the manufacturing sector witnessed a steady decrease, and agriculture had undergone a dramatic decline by the end of the century. Manufacturing accounted […]

The graph below shows the contribution of three sectors, agriculture manufacturing and business and financial services to the UK economy in the twentieth century.summarizing information by selecting and reporting the main features and make a comparisons were relevant.

The Bart chart describes data about three different fields – agriculture, manufacturing, and business and financial services- contributed to the economy in the UK in last the century. Overall, there were downward trends in the contribution of agriculture and manufacturing, while business and financial services experienced an upward trend, becoming the most profitable. Focusing on […]

See All

Other Topics:

The graph below shows the number of university graduates in Canada from 1981 to 2022. Summarise the information by selecting and reporting the main features and make comparisons where relevant.

The bar chart illustrates the amount of university graduates in Canada belonging to two different groups: male and female between 1981 and 2022. Overall, women had more university degrees than men over the all period. The highest number was recorded between 2011 and 2020, while the lowest between 1991 and 20000. All groups designed in […]

the chart below compares levels of recycling, as well as some less environmentally friendly forms of waste management, in fifteen European countries

The bar chart illustrates the proportion of recycling and other type of waste management such as landfill and incineration in fifteen European countries. Overall, the percentage of landfill form in waste management have the majority among all the waste methods in Greece, Ireland, the UK, Italy, Portugal, Spain and Finland, with over half of the […]

The bar chart below shows the percentage of people in five different age groups in the UK who used online banking in 2010 and 2025.

The bar chart provided information regarding the rate of peoplein five different age groups, at the range 18 to 55+. In Uk who have used online banking between the years 2010 and 2025. Overall, the younger age group seems to be at the top of the lead for both years, While the olders age takes […]

The chart below shows the average hours spent per day in leisure and sports activities, by the youngest and oldest populations, in the US, in 2015.

The chart illustrates the hours spent on the most popular leisure and physical activities among people over 75 and teens aged 15 to 19 in the USA in 2015. Overall, watching television was the most popular activity among Americans, while they were not quite satisfied with chilling and thinking. Sports, playing video games, and communication […]

The chart below shows the number of books borrowed from a public library, by type of book, in 2010 and 2020 (in thousands). Summarise the information by selecting and reporting the main features, and make comparisons where relevant.

The bar chart compares how many books and which types people borrowed from a public library to read in 2010 and 2020. Overall, the number of books increased in every type over the ten – year period. Fiction books were the first most popular type, while history books took the lowest position between this period. […]

The chart shows the division of household tasks bu gender in Great Britain. Write a report for a university lecturer describing the information shown below.

The bar chart illustrates the proportion of households divided by two genders in Great Britain in only one day. Overall, females accounted for the majority in household chores, cooking and supervising children while males made up mainly in gardening and maintaining jobs. Another noticeable feature is that doing household chores had significant differences between men […]

See All
We have detected unusual activity on your device.
Please verify your identity to continue.
Note: This verification step won't sign you in. If you have a premium account, please log in to access the service as usual.
Google/Gmail Verification
Or verify using Email/Code
We've sent a verification code to:
youremail@gmail.com (Not your email?)
Enter it below to complete the verification process.
Ensure your email address is correct, your inbox is not full, and you check your spam folder. If no email arrives, consider using an alternative email.
You will need a Premium plan to perform your action!
Note: If you already have a premium account, please log in to access our services as usual.

Plans & Pricing

Our mission is to make quality education accessible for everyone.
However, to keep our hardworking team running and this service alive, we genuinely need your support!
By opting for a premium plan, not only do you sustain us in achieving the mission, but you also unlock advanced features to enrich your learning experience.

Free

For learners who aren't pressed for time

What's included on Free
100+ Cambridge IELTS Tests
Instant IELTS Writing Task 1 & 2 Evaluation (2 times/month)
Instant IELTS Speaking Part 1, 2, & 3 Evaluation (2 times/month)
Instant IELTS Writing Task 1 & 2 Essay Generator (2 times/month)
500+ Dictation & Shadowing Exercises
100+ Pronunciation Exercises
Flashcards
Other Advanced Tools

Premium

For those serious about advancing their English proficiency, and for IELTS candidates aspiring to boost their band score by 1-2 points (especially in writing & speaking) in just 30 days or less

What's included on Premium
Save Your IELTS Test Progress & Analyze Mistakes By Question Type
Save Your Own Flashcard Sets & Use Them On Any Device
Unlock All Courses, IELTS Tests, Section & Part Practice
Unlimited AI Conversations
Unlimited AI Writing Enhancement Exercises
Unlimited IELTS Writing Task 1 & 2 Evaluation
Unlimited IELTS Speaking Part 1, 2, & 3 Evaluation
Checked Answers Will Not Be Published
Unlimited IELTS Writing Task 1 & 2 Essay Generator
Unlimited IELTS Speaking Part 1, 2, & 3 Sample Generator
Unlimited Usage Of Advanced Tools & AI Features
Priority Support within 24h (12-month plan only)

Due to the nature of our service and the provided free trials, payments are non-refundable.