Our system will evaluate the answer based on this AI-generated description.
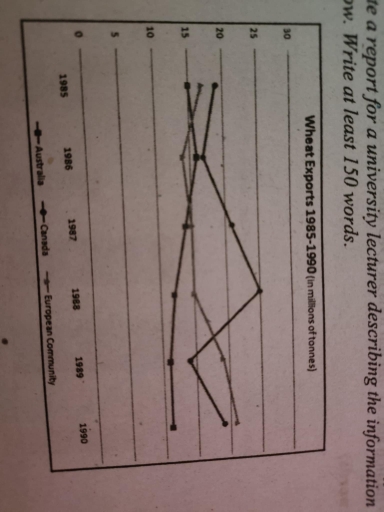
The image contains a graph depicting wheat exports (in millions of tonnes) from 1985-1990 for Australia, Canada, and the European Community. In 1985, Australia's exports were 15 million tonnes, Canada's were 19 million tonnes, and the European Community's were 13 million tonnes. In 1986, Australia's exports dropped to 11 million tonnes, Canada's fell to 17 million tonnes, and the European Community's slightly decreased to 12 million tonnes. In 1987, Australia exported 12 million tonnes, Canada 12 million tonnes, and the European Community 16 million tonnes. For 1988, Australia's exports rose sharply to 21 million tonnes, Canada's increased to 15 million tonnes, and the European Community's decreased slightly to 14 million tonnes. In 1989, Australia's exports were 18 million tonnes, Canada's slightly increased to 20 million tonnes, and the European Community peaked at 23 million tonnes. By 1990, Australia's exports increased to 22 million tonnes, Canada's dropped to 18 million tonnes, and the European Community's significantly fell to 12 million tonnes.
Given the complexity of the image, the above description may not be entirely accurate.
Skyrocket your IELTS band score by 1-2 points in under a month with our premium plan!
Note: Both the topic and the answer were created by one of our users.
The given line graph illustrates the disparities in Australia, Canada and European communitiy wheat exportation between 1985 and 1990. Overall, it is clear that all statics have an erratic trajectory. While Canada data dominated through most of the surveyed period, Australia number was at the other end.
Regarding the amount of wheat Canada exported in the 15 years period, in 1985, the figure were around 20 millions tonnes of wheat, hence, it retracted by 3 millions of tonnes in the next year. Despite the fell in 1986, the figure soon rebound and constituted the largest portion of wheat exports. While it was recorded to recede from 25 millions of tonnes to only 14 millions of tonnes in 1989, the sale revenue reclaim it original position one year later.
Shifting our attention the remaining figures, Australia was seen standing at 15 millions tonnes in the first year. However, after a marginal increment by 2 millions of tonnes in 1986, the data for Australia soon decline steadily before stopping at 11 millions of tonnes in the last year. About the European community figure, in 1986, the wheat exportation have dipped from 19 millions of tonnes to 14 millions of tonnes. During the following year, it slightly went up by 1 millions of tonnes then remained plateaued. From 1988 to 1990, the figures rose substantially to 21 millions of tonnes.
Word Count: 227
