Our system will evaluate the answer based on this AI-generated description.
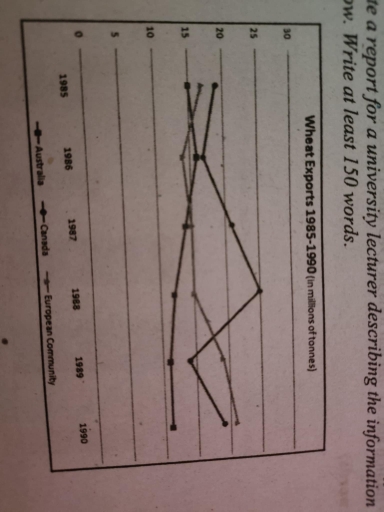
The image contains a graph depicting wheat exports (in millions of tonnes) from 1985-1990 for Australia, Canada, and the European Community. In 1985, Australia's exports were 15 million tonnes, Canada's were 19 million tonnes, and the European Community's were 13 million tonnes. In 1986, Australia's exports dropped to 11 million tonnes, Canada's fell to 17 million tonnes, and the European Community's slightly decreased to 12 million tonnes. In 1987, Australia exported 12 million tonnes, Canada 12 million tonnes, and the European Community 16 million tonnes. For 1988, Australia's exports rose sharply to 21 million tonnes, Canada's increased to 15 million tonnes, and the European Community's decreased slightly to 14 million tonnes. In 1989, Australia's exports were 18 million tonnes, Canada's slightly increased to 20 million tonnes, and the European Community peaked at 23 million tonnes. By 1990, Australia's exports increased to 22 million tonnes, Canada's dropped to 18 million tonnes, and the European Community's significantly fell to 12 million tonnes.
Given the complexity of the image, the above description may not be entirely accurate.
Skyrocket your IELTS band score by 1-2 points in under a month with our premium plan!
Note: Both the topic and the answer were created by one of our users.
The line graph compares three regions in terms of exports of wheat between 1985 and 1990.
Overall, the three regions experienced different trends in the time period. While the two country canada and Europian communityrose with some fluctuation, Australia’s exports fell over time.
As the graph shows, Australia’s export figure started 15 million tons of wheat in 1985, then it has a slighty growth to 16 ton in 1986. Then it declined steadily untill it fell to just over 10 million tons in 1990. Regarding, canada’s export in 1985 they shipped approximately 19 million tons of wheat. This figure fell to nearly 17 million tons in 1986, but then it witnessed a considerable rose to 25 million in 1988. Afterward this figure plunged to below 15 million in 1989. But then subsequently rose to just under 20 million in 1990.
By contrast, Europian community experienced an increase in the six years. At the beginning of the period it contributed 18 million. However, it demonstrated just under 15 million in 1986. Fortunately this figure continued growth untill 1990 and reached almost 21 million.
Word Count: 182
