🔥 Today Only: Save 30% on Premium — Offer Ends Soon! - Upgrade Now!
Table

Band 8+: The graph below shows the information about medical care in three European countries between 1980 and 2000.

Image for topic: The graph below shows the information about medical care in three European countries between 1980 and 2000.
Our system will evaluate the answer based on this AI-generated description.
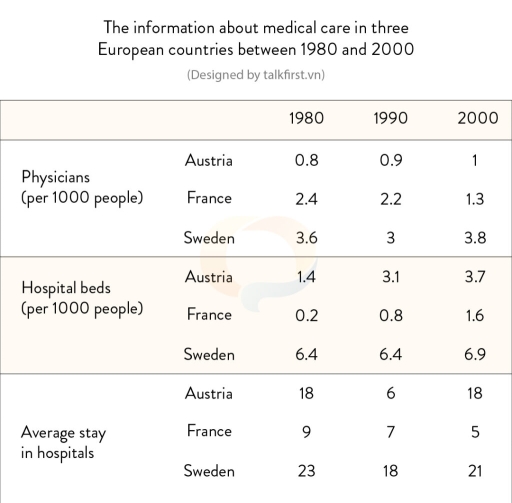
The image presents three tables with data about medical care in Austria, France, and Sweden between 1980 and 2000; the first table shows the number of physicians per 1000 people, where Austria had 0.8 in 1980, 0.9 in 1990, and 1 in 2000, France had 2.4 in 1980, 2.2 in 1990, and 1.3 in 2000, and Sweden had 3.6 in 1980, 3 in 1990, and 3.8 in 2000; the second table lists hospital beds per 1000 people, where Austria had 1.4 in 1980, 3.1 in 1990, and 3.7 in 2000, France had 0.2 in 1980, 0.8 in 1990, and 1.6 in 2000, and Sweden had 6.4 in both 1980 and 1990, and 6.9 in 2000; the third table contains data about the average stay in hospitals, indicating that Austria had 18 days in 1980, 6 days in 1990, and 18 days in 2000, France had a decreasing trend with 9 days in 1980, 7 days in 1990, and 5 days in 2000, and Sweden decreased from 23 days in 1980 to 18 days in 1990, then increased to 21 days in 2000.
Given the complexity of the image, the above description may not be entirely accurate.
Note: Both the topic and the answer were created by one of our users.

The table compares how medical aspect change in three European nations from 1980 to 2000

Overall, it is clear that the figures for Sweden in all aspects were significantly higher than that of France and Austria.

In 1980, Sweden had 3.6 physicians and 6.4 beds per 1000 people, and an average stay in hospitals of 23 days. Austria had the fewest doctors per 1000 people, at 1.4, while the number of hospital beds in France was lowest, at 0.2 beds per 1000 people. Furthermore, the average hospital stay in Austria was twice as long as that of France, at 18 and 9 days respectively.

By 2000, the average number of physicians per 1000 people in Austria and Sweden both saw a modest increase to 1 and 3.8 doctors respectively, while the opposite was true for France’s figure, which decreased to 1.3. All three countries saw an increase in hospital beds per 1000 people, with 6.9 in Sweden, 1.6 in France, and 3.7 in Austria. Average hospital stay times in both France and Sweden saw a significant decrease by 2000, to 5 and 21 days, while the figure for Austria remained unchanged after 20 years.

Word Count: 194

Answers On The Same Topic:

The graph below shows the information about medical care in three European countries between 1980 and 2000.

The table compares three countries, namely Austria, France, and Sweden, in terms of physicians, hospital beds, and average days spent in hospitals between 1980 and 2000. Overall, the number of hospital beds showed increases in all countries, while the number of physicians and average days spent in hospital reported varying fluctuations. It is also noticeable […]

The graph below shows the information about medical care in three European countries between 1980 and 2000.

The table compares the number of physicians and hospital beds per 1000 people, together with the average length of hospital stays, in Austria, France and Sweden in 1980, 1990, and 2000. Overall, Sweden consistently had the highest number of hospital beds throughout the period, while France experienced a moderate decline in both the number of […]

The graph below shows the information about medical care in three European countries between 1980 and 2000.

The table provides information about three distinct categories in medical healthcare across three different countries, namely Austria, France, and Sweden during three years: 1980, 1990 and 2000. Overall, it is noticeable that Sweden recorded the highest figures in all given categories throughout the period. In addition, only the hospital beds section experienced an upward trend […]

The graph below shows the information about medical care in three European countries between 1980 and 2000.

The following graph shows the data about medical care in three European countries from 1980 to 2000. Overall, the biggest change was exhibited by Austria and France on Hospitals beds. The biggest proportion of each three sections (Physicians, Hospital beds, Average stay in hospitals) was belonged to Sweden over the period 1980 and 2000. The […]

See All

Other Topics:

The table below shows the percentage of working men and women in different areas of employment in one country in 1986, 1996 and 2006

The table compares the proportions of men and women employed in four sectors in 1986, 1996 and 2006. Overall, manufacturing showed a clear downward trend for both genders, while education remained the dominant sector for women and increased steadily. Meanwhile, banking and catering experienced consistent growth, particularly among men. Male employment in manufacturing underwent a […]

The table shows the amount of money given to developing countries by the USA,EU countries and other countries from 2006 to 2010(figures are in millions of dollars)

The given table illustrate the number of money given to modern countries by the USA, EU countries and other countries between 2006 and 2010. Firstly, USA in 2006 was 9,8. That result rose to 11 during 2007. In 2008, we can notice sharply jamp to 17. But, in 2009 this growth declined bit by bit […]

The table below shows the change in the percentages of people joining in seven different sports in an European country from 1999 to 2009. Summarise the information by selecting and reporting the main features, and make comparisons where relevant.

The table compares the proportion of people entering in seven various sports in Europe over the period from 1999 to 2009. As can be seen from the table, the figures in the first three sports are more noticable than the rest. Overall, it is clear from the table that every proportion in every sport always […]

The table below shows the most popular types of holiday activities amongst British senior high schools students in 2003.

The illustrated table demonstrates the most common hobbies that British senior high school students preferred to do during their holidays in 2003. Overall, it is clear that the majority of pupils of both genders watched movies in their free time. While male students were devoted to playing sports, females liked reading and shopping activities more […]

The chart below shows the percentage of households in a city that owned different types of technology in 2010 and 2020.

The chart illustrates the percentage of different households in a city. In the table there are two years are mentioned who owned unique type of technology. Initially, Desktop computer in 2010 was considered as a top ranked as 70 percent used . As compare to 2020 , computer decline it’s ratio 30 percent. After 10 […]

This table show how many prople (in millions) used different form public transport in Milan between 2010 and 2014.

The table provides information about how many population in Milan used public transportation from 2010 to 2014. Overall, the metro was the most popular public transportation of all the categories and reached its peak in 2014, while taxis were the least used transportation over the past 4 years. All the catogories show an upward trend, […]

See All
We have detected unusual activity on your device.
Please verify your identity to continue.
Note: This verification step won't sign you in. If you have a premium account, please log in to access the service as usual.
Google/Gmail Verification
Or verify using Email/Code
We've sent a verification code to:
youremail@gmail.com (Not your email?)
Enter it below to complete the verification process.
Ensure your email address is correct, your inbox is not full, and you check your spam folder. If no email arrives, consider using an alternative email.
You will need a Premium plan to perform your action!
Note: If you already have a premium account, please log in to access our services as usual.

Plans & Pricing

Our mission is to make quality education accessible for everyone.
However, to keep our hardworking team running and this service alive, we genuinely need your support!
By opting for a premium plan, not only do you sustain us in achieving the mission, but you also unlock advanced features to enrich your learning experience.

Free

For learners who aren't pressed for time

What's included on Free
100+ Cambridge IELTS Tests
Instant IELTS Writing Task 1 & 2 Evaluation (2 times/month)
Instant IELTS Speaking Part 1, 2, & 3 Evaluation (5 times/month)
Instant IELTS Writing Task 1 & 2 Essay Generator (2 times/month)
500+ Dictation & Shadowing Exercises
100+ Pronunciation Exercises
Flashcards
Other Advanced Tools

Premium

For those serious about advancing their English proficiency, and for IELTS candidates aspiring to boost their band score by 1-2 points (especially in writing & speaking) in just 30 days or less

What's included on Premium
Save Your IELTS Test Progress
Unlock All Courses & IELTS Tests
Unlimited AI Conversations
Unlimited AI Writing Enhancement Exercises
Unlimited IELTS Writing Task 1 & 2 Evaluation
Unlimited IELTS Speaking Part 1, 2, & 3 Evaluation
Checked Answers Will Not Be Published
Unlimited IELTS Writing Task 1 & 2 Essay Generator
Unlimited IELTS Speaking Part 1, 2, & 3 Sample Generator
Unlimited Usage Of Advanced Tools
Priority Support within 24h (12-month plan only)

Due to the nature of our service and the provided free trials, payments are non-refundable.
Nếu bạn là người Việt Nam và không có hoặc không muốn trả bằng credit/debit cards, bạn có thể thanh toán bằng phương thức chuyển khoản:


Chọn gói:
419,000₫ 277,000 ₫ cho gói 1 tháng (chỉ 9,233₫/ngày)
1,239,000₫ 597,000 ₫ cho gói 3 tháng (chỉ 6,633₫/ngày)
2,469,000₫ 1,027,000 ₫ cho gói 6 tháng (chỉ 5,706₫/ngày)
4,929,000₫ 1,417,000 ₫ cho gói 12 tháng (chỉ 3,936₫/ngày)


Sau khi chuyển khoản, vui lòng đợi trình duyệt tự động điều hướng bạn trở lại Engnovate và bạn sẽ ngay lập tức nhận được mã kích hoạt tài khoản premium.
Nếu có lỗi xảy ra, bạn có thể liên hệ với team thông qua một trong các phương thức: email đến helloengnovate@gmail.com hoặc nhắn tin qua facebook.com/engnovate.
Vì toàn bộ công cụ trên website đều có thể sử dụng thử miễn phí, Engnovate không hỗ trợ hoàn tiền.