Our system will evaluate the answer based on this AI-generated description.
The image contains a line graph depicting the number of enquiries received by the Tourist Information Office in one city over a six-month period in 2011. The graph displays three lines representing enquiries made in-person, by letter/email, and by telephone. The x-axis spans from January to June, while the y-axis represents the number of enquiries, ranging from 0 to 2000 in increments of 200. In January, enquiries made in person and by telephone start at 200, while enquiries by letter/email start at 400. By February, in-person enquiries increase to 600, letter/email decrease to 200, and telephone enquiries remain the same. In March, in-person and letter/email enquiries both rise to 800, and telephone enquiries increase to 600. April shows in-person enquiries at 1200, letter/email at 400, and telephone at 1400. In May, in-person jumps to 1600, letter/email decreases again to 300, and telephone rises to 1600. Finally, by June, in-person enquiries are at 1800, letter/email are at 200, and telephone enquiries peak at 1800.
Given the complexity of the image, the above description may not be entirely accurate.
Skyrocket your IELTS band score by 1-2 points in under a month with our premium plan!
Note: Both the topic and the answer were created by one of our users.
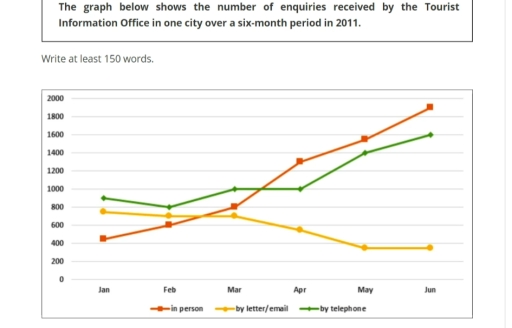
The line graphillustrates how many questions were given by the Tourist Information Office in one region during the 2011.
Overall, the diagram demonstrates the changes in the number of investigations received in person, by letters and by telephone from January to June, in 2011.
First at all, a significant rise in questions given in person was observed. The initial number was just overthe 400 in January, this followed by a stable increase reaching the exact 800 in March. Significantly, thetrend went up sharply over the next months until reached the highest point with approximately 1900 figures at the end of given period.
Similarly, enquires given via telephones showed a relative growth. It is clear that the phones used to be at the peak at the beginning of period under question and experienced a slight decline overthe next month. By June, the numbers have surged at 1600 enquiries.
Conversely, letters or emails underwent a noticeable decrease. In January statistic in letters were around 750, then went down continuously before reachingthe bottom of graph, with roughly390.
Word Count: 174
