Our system will evaluate the answer based on this AI-generated description.
The image contains a line graph depicting the number of enquiries received by the Tourist Information Office in one city over a six-month period in 2011. The graph displays three lines representing enquiries made in-person, by letter/email, and by telephone. The x-axis spans from January to June, while the y-axis represents the number of enquiries, ranging from 0 to 2000 in increments of 200. In January, enquiries made in person and by telephone start at 200, while enquiries by letter/email start at 400. By February, in-person enquiries increase to 600, letter/email decrease to 200, and telephone enquiries remain the same. In March, in-person and letter/email enquiries both rise to 800, and telephone enquiries increase to 600. April shows in-person enquiries at 1200, letter/email at 400, and telephone at 1400. In May, in-person jumps to 1600, letter/email decreases again to 300, and telephone rises to 1600. Finally, by June, in-person enquiries are at 1800, letter/email are at 200, and telephone enquiries peak at 1800.
Given the complexity of the image, the above description may not be entirely accurate.
Skyrocket your IELTS band score by 1-2 points in under a month with our premium plan!
Note: Both the topic and the answer were created by one of our users.
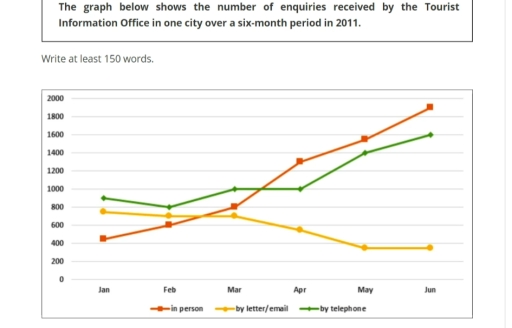
The line chart provides key information about figures of enquiries collected by the tourist information office in one city over a six month period in 2011. The unit are measured by numbers.
Overall, it is clear from the graph that tourist in person had more increased through the months. In addition tourist by telephone had fluctuated at the beginning of the month but at the end became the second highest way of collecting information whereas by letter/email showed significant decrease across the months.
According to what is shown received tourist information in person started in January by 400 and had increased double the number in March reaching 800. Over the months, it increased between 1600 and 1,800 in June. Accept the tourist information by telephone concern it above 800 in January and got unsteady increase until April reaching 1000. However, turned in line and increased to nearly 1600.
In terms of obtaining information by letters/email, it initiated slightly below 800, and had insignificant decrease till March but after that, it has a noticeable decrease up to me and then follow it by being constant in the last two months it’s nearly below 400.
Word Count: 193
