Our system will evaluate the answer based on this AI-generated description.
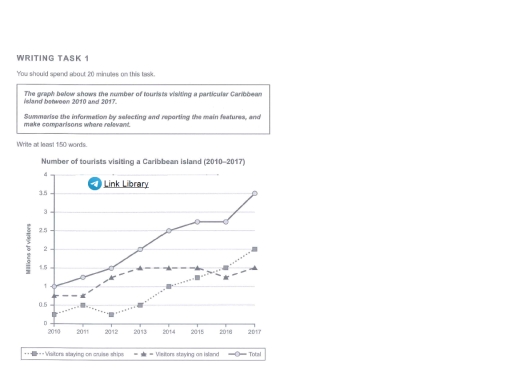
The image presents data detailing the number of tourists visiting a Caribbean island annually from 2010 to 2017, segmented between visitors staying on cruise ships and those staying on the island, with totals. In 2010: cruise ship visitors at 0.3 million, island visitors at 0.7 million, totaling 1 million; in 2011: cruise ship visitors at 0.5 million, island visitors at 0.7 million, totaling 1.2 million; in 2012: cruise ship visitors at 0.5 million, island visitors at 0.8 million, totaling 1.3 million; in 2013: cruise ship visitors at 0.6 million, island visitors at 1 million, totaling 1.6 million; in 2014: cruise ship visitors at 0.7 million, island visitors at 1.2 million, totaling 1.9 million; in 2015: cruise ship visitors at 1.3 million, island visitors at 1.3 million, totaling 2.5 million; in 2016: cruise ship visitors at 1.5 million, island visitors at 1.4 million, totaling 2.9 million; and in 2017: cruise ship visitors at 2 million, island visitors at 1.5 million, totaling 3.5 million.
Given the complexity of the image, the above description may not be entirely accurate.
Skyrocket your IELTS band score by 1-2 points in under a month with our premium plan!
Note: Both the topic and the answer were created by one of our users.
The line graph demonstrates the proportion of tourists visited a particular Caribbean island from 2010 to 2017.
Overall, it is evident that tourists who were staying on island was higher than who were stayed on cruise ship and total number of visitors was significantly up surged in given period.
To begin with, there were less than 0.5 million visitors that staying on cruise ship in 2010 and it flatuated for two years. Afterthat, score of tourists for visiting Caribbean island and staying on cruise ship was significantly skyrocket to almost 2 million of visitors in the year of 2017.
Furthermore, tourists who were staying on island was accounted for 0.75 million of visitors in 2010 which remained for next one year and then, it was gradually inclined to 1.5 million visitors in 2015. However, in 2016 it had some decreasing trend and came back to 1.5 million visitors in 2017. The ratio of total number of visitors had increasing trend during the year of 2010 to 2017
Word Count: 167
