Our system will evaluate the answer based on this AI-generated description.
The image is a line graph with horizontal x-axis labeled with months from Jan to Jun, and a vertical y-axis with values ranging from 0 to 2000 in increments of 200. There are three lines representing different modes of communication; "IN PERSON" starts around 600 in Jan, rises to approximately 800 in Feb, dips slightly below 600 in Mar, increases to roughly 1000 in Apr, and continues to rise steeply to just above 1800 by Jun. "BY LETTER/EMAIL" begins just above 200 in Jan, gradually ascends to nearly 400 in Feb, surpasses 600 in Mar, climbs above 800 in Apr, and reaches nearly 1400 by Jun. "BY TELEPHONE" commences around 1200 in Jan, slightly declines to around 1100 in Feb, drops to about 1000 in Mar, remains stable in April, then mildly increases to just above 1000 in May and continues to just below 1200 in Jun. There are no numerical data points or percentages explicitly shown on the graph, only approximate values can be inferred from the positions of the lines relative to the y-axis.
Given the complexity of the image, the above description may not be entirely accurate.
Skyrocket your IELTS band score by 1-2 points in under a month with our premium plan!
Note: Both the topic and the answer were created by one of our users.
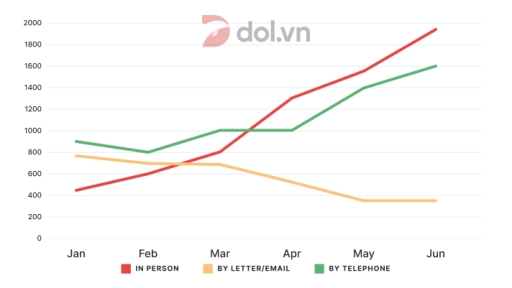
The line chart illustrates how many enquiries received by the Tourist Information Office in the city during the first 6 months of the year 2011.
Overall, it is clear that the number of enquiries for in person and by telephone experienced a significant growth, whereas the figure for by letter or email fell gradually over the period.
Looking at the graph, one can see that in January, the quantity of enquiries received in person was the fewest, at more than 400 compared to ones by telephone at almost 900 and by letter or email at nearly 800. However, in June, the figure for in person peaked at roughly 2000, becoming the highest point among 3 forms of enquiry. This was followed by telephone at around 1600, and eventually by letter or email at nearly 400.
It can also be seen that the number of enquiries for in person surpassed the figure for by telephone between February and March, and the other received by letter or email between March and April. In the end of the period, the gap between the two received by telephone and by letter or email was approximately three- quarters of the gap between the two for in person and by letter or e
mail.
Word Count: 208
