🔥 Today Only: Save 30% on Premium — Offer Ends Soon! - Upgrade Now!
Line Graph

Band 5+: The graph below shows the number of overseas visitors to three different areas in a European country between 1987and 2007. Summarizetheinformationbyselectingandreportingthemainfeatures,and makecomparisonswhererelevant.

Image for topic: The graph below shows the number of overseas visitors to three different areas in a European country between 1987and 2007. Summarizetheinformationbyselectingandreportingthemainfeatures,and makecomparisonswhererelevant.
Our system will evaluate the answer based on this AI-generated description.
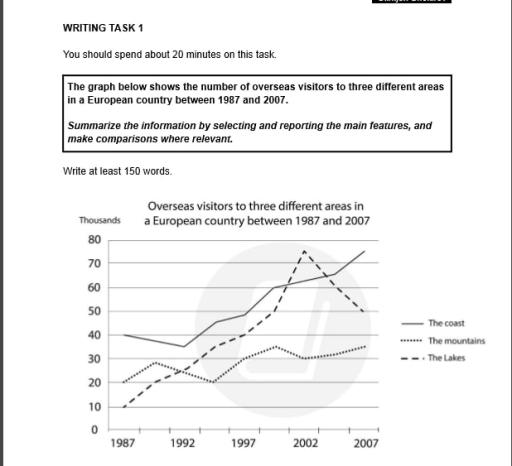
The image presents a line graph illustrating overseas visitors in thousands to three areas: The coast, The mountains, and The Lakes from 1987 to 2007. In 1987, The coast had 40, The mountains 20, and The Lakes 10. By 1989, The coast fell to 35, The mountains rose to 25, and The Lakes reached 25. In 1991, The coast climbed back to 40, The mountains stable at 25, and The Lakes advanced to 35. In 1993, The coast slightly declined to 38, The mountains marginally up to 28, and The Lakes slightly retreated to 30. In 1995, The coast saw a drop to 35, The mountains constant at 30, and The Lakes peaked at 40. In 1997, The coast recovered to 40, The mountains unchanged at 30, and The Lakes declined to 30. By 1999, The coast improved to 45, The mountains increased to 35, and The Lakes boosted to 40. In 2001, The coast continued up to 55, The mountains maintained 35, and The Lakes spiked to 75. In 2003, The coast leveled at 60, The mountains climbed to 38, and The Lakes slightly fell to 65. In 2005, The coast reached 70, The mountains sustained at 40, and The Lakes dropped to 60. Finally, in 2007, The coast attained 75, The mountains reached 35, and The Lakes stabilized at 50.
Given the complexity of the image, the above description may not be entirely accurate.
Note: Both the topic and the answer were created by one of our users.

The line graph illustrates the number of three different popular areas, such as:coast, mountains and lakes to visit in a European country between 1987 and 2007.

Overall, the coast remaines stable as popular place to visit in Europe, and the lakes gained popularity through the 20 years period, while the mountains crept up in fame.

In 1987, the coast was one of the most popular places in European countries to visit, with 40,000 tourists and in 1992 coast edged down to 35,000 tourists approximately and to 2007 constants as famous areas for tourists with 75,000 tourists around. Meanwhile, the lakes in 1987 was not most popular place among tourists but by the time mountains attracted more visitors and increased significantly in 2002 overtaking coasts with 75,000 tourists but in 2007 dipped and stayed as second favourite area to visit.

The second popular place for visitors between 1987 and 1992 was the mountaines with 20,000 tourists to 28,000 approximately, and closer to 1997 witnessed some decline in popularity and between 1997 and 2002 crept up in visitors to 35,000 and by 2007 became the third place for visiting in Europe

Word Count: 189

Answers On The Same Topic:

The graph below shows the number of overseas visitors to three different areas in a European country between 1987and 2007. Summarizetheinformationbyselectingandreportingthemainfeatures,and makecomparisonswhererelevant.

The line graph illustrates the number of three different popular areas, such as:coast, mountains and lakes to visit in a European country between 1987 and 2007. Overall, the coast remaines stable as popular place to visit in Europe, and the lakes gained popularity through the 20 years period, while the mountains crept up in fame. […]

The graph below shows the number of overseas visitors to three different areas in a European country between 1987and 2007. Summarizetheinformationbyselectingandreportingthemainfeatures,and makecomparisonswhererelevant.

The data represent the number of overseas visitors between 1987 and 2007,divided into different areas in European,along with the line grade of change. Overall, The total of line graph show some fluctuation over the period.Whlie the cost and the mountains line experienced increased,the lakes line saw small declines. In detail, the total number of visitor […]

The graph below shows the number of overseas visitors to three different areas in a European country between 1987and 2007. Summarizetheinformationbyselectingandreportingthemainfeatures,and makecomparisonswhererelevant.

The line graph provides information about the number of overseas visitors who visited three distinct areas in a European nation over a 20-year period. Overall, it is clear that visitor numbers to both the lake and the coast increased significantly, while the mountains experienced a slight decline. In 1987, the coast was the most popular […]

The graph below shows the number of overseas visitors to three different areas in a European country between 1987and 2007. Summarizetheinformationbyselectingandreportingthemainfeatures,and makecomparisonswhererelevant.

The line graph illustrates how many overseas tourists went to three distinct places in a certain European country over two decades. Overall, it is clear that all of those places showed upward trends, the coast was the most popular among tourists, followed closely by the Lakes where experienced fivefold rise, and distantly by the mountains, […]

See All

Other Topics:

The graph below shows the average monthly temperatures in three major cities. summarize the information by selecting and reporting the main features and make comparison were relevant

The line graph gives information about temperature fluctuation in Paris, Boston and Melboume from in one year from January to the end of December. The most significant facts to emerge from the graph are that two cities temperature reached a high in August. Malboume has the opposite trend. Melboume is the warmest city in which […]

The given graph shows the past and projected figures of the government spending as a percentage of GDP for the years 2000 to 2025 in three areas. Summarise the information by selecting and reporting the main features and make comparisons where relevant.

The picture illustrates the three different projected figures of the government utilizing as a percentage of GDP from 2000 to 2025. As clearly seen, the rate of health has increased constantly greater than other proponents during the period. It started with exactly four percent at the beginning, and the rate rose until 2025. On the […]

the graph shows how londeners commute to work. Describe it

The line graph provides information about how people of London commute to work by utilizing distinct types of transport forms between 1970 and 2010. Overall, use of bus and car observed substantial decrease at its numbers, while subway followed an opposite trend. Similarly, to subway both bicycle and walking to the work rise modestly over […]

The line graph shows the percentage ofdifferent age groups ofcinema visitors in a particular country from 1978 to 2008.

The line graph provides information about the ratio of different age classifications of cinema watchers in a specific country between 1978 and 2008. The figures expressed in percentage. Overall, cinema movies were most popular among ages 14-24, whereas the age group above 50 were likely to visit cinemas. In detail, a fluctuation pattern can be […]

The graph below shows the number of students studying Computer Science at a university from 2010 to 2020.

The line graph illustrates the number of students who studied computer science at a university between 2010 and 2020. Overall it is clearly seen that, the number of computer science students increased over the period. Although there was a slight decline in 2016, the figure then rose sharply and reached its highest point in 2020. […]

The graph below gives information about the percentage of the population in four Asian countries living in c/tles from 1970 to 2020, with predictions for 2030 and 2040. Summarise the information by selecting and reporting the main features, and make comparisons where relevant.

The followig line chart illustrates the growth of indvisuals living in asian cites through 1970 to 2020, as well as, prections for the upcoming 20 years. As showen in the graph through out the years all populations in all of the Four cites climbed, but the highest being Indonesia and Malaysia( at about 60% and […]

See All
We have detected unusual activity on your device.
Please verify your identity to continue.
Note: This verification step won't sign you in. If you have a premium account, please log in to access the service as usual.
Google/Gmail Verification
Or verify using Email/Code
We've sent a verification code to:
youremail@gmail.com (Not your email?)
Enter it below to complete the verification process.
Ensure your email address is correct, your inbox is not full, and you check your spam folder. If no email arrives, consider using an alternative email.
You will need a Premium plan to perform your action!
Note: If you already have a premium account, please log in to access our services as usual.

Plans & Pricing

Our mission is to make quality education accessible for everyone.
However, to keep our hardworking team running and this service alive, we genuinely need your support!
By opting for a premium plan, not only do you sustain us in achieving the mission, but you also unlock advanced features to enrich your learning experience.

Free

For learners who aren't pressed for time

What's included on Free
100+ Cambridge IELTS Tests
Instant IELTS Writing Task 1 & 2 Evaluation (2 times/month)
Instant IELTS Speaking Part 1, 2, & 3 Evaluation (2 times/month)
Instant IELTS Writing Task 1 & 2 Essay Generator (2 times/month)
500+ Dictation & Shadowing Exercises
100+ Pronunciation Exercises
Flashcards
Other Advanced Tools

Premium

For those serious about advancing their English proficiency, and for IELTS candidates aspiring to boost their band score by 1-2 points (especially in writing & speaking) in just 30 days or less

What's included on Premium
Save Your IELTS Test Progress & Analyze Mistakes By Question Type
Save Your Own Flashcard Sets & Use Them On Any Device
Unlock All Courses, IELTS Tests, Section & Part Practice
Unlimited AI Conversations
Unlimited AI Writing Enhancement Exercises
Unlimited IELTS Writing Task 1 & 2 Evaluation
Unlimited IELTS Speaking Part 1, 2, & 3 Evaluation
Checked Answers Will Not Be Published
Unlimited IELTS Writing Task 1 & 2 Essay Generator
Unlimited IELTS Speaking Part 1, 2, & 3 Sample Generator
Unlimited Usage Of Advanced Tools & AI Features
Priority Support within 24h (12-month plan only)

Due to the nature of our service and the provided free trials, payments are non-refundable.