Our system will evaluate the answer based on this AI-generated description.
The image displays a graph detailing yearly tourist visits to a Caribbean island from 2010 to 2017, divided into three categories: cruise ship visitors, island-staying visitors, and total visitors. In 2010, cruise ship visitors total 0.5 million, island-staying visitors 0.75 million, and total visitors 1.25 million. In 2011, cruise ship visitors reach 0.75 million, island visitors 0.9 million, totaling 1.6 million. By 2012, cruise visitors remain steady at 0.75 million while island visitors hold at 1 million, with total visitors hitting 1.75 million. In 2013, cruise visitors increase to 1 million, island visitors stagnant at 1 million, resulting in 2 million total visitors. In 2014, cruise ship visitors rise to 1.25 million, island stays dip to 0.9 million, totaling 2.15 million. In 2015, cruise visitors are 1.5 million, island visitors climb to 1.25 million, totaling 2.75 million. In 2016, cruise visitors expand to 1.5 million, island stays remain 1.25 million, totaling 2.75 million. Finally, in 2017, cruise visitors peak at 2 million, island visitors stabilize at 1.5 million, culminating in 3.5 million total visitors.
Given the complexity of the image, the above description may not be entirely accurate.
Skyrocket your IELTS band score by 1-2 points in under a month with our premium plan!
Note: Both the topic and the answer were created by one of our users.
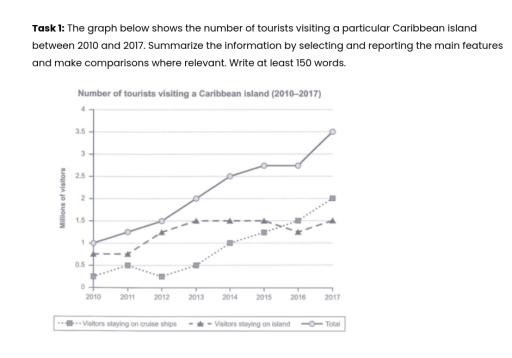
The data illustrates the count of tourists in millions visiting a certain island in the Caribbean between 2010 and 2017.
Overall, the number of tourists on the island increased gradually over the time period while their means of staying had fluctuated between cruise ships and the island. At the beginning, more visitors prefer to stay on the island than on cruise ships. However, this figure reversed at the end of the year.
In 2010, one million visitors visited an island where around 0.8 million stayed on the island, and the rest chose cruise ships. This trend remained stable for staying on the island in 2011; meanwhile, visitors staying on ships increased to 0.5 overall, increasing the total tourist count to around 1.3 million. Accommodation on the island gradually increased and reached 1.5 in 2013, while cruise ships experienced a slight drop in 2012, reaching 0.2, which rose in 2013 to 0.5, making the overall tourist count 2 million in 2013.
From 2013, the trend for staying on the island remained stable to 2017, having a value of 1.5 million, while the number of tourists staying on ships gradually climbed each year and peaked in 2017, having a count of 2 million. The total tourist count at the end of 2017 was 3.5 million, which was the highest between these years.
Word Count: 220
