🔥 Today Only: Save 30% on Premium — Offer Ends Soon! - Upgrade Now!
Line Graph

Band 4+: The graph below shows the percentage of adults who read books in four different countries between 2010 and 2022. Summarize the information by selecting and reporting the main features, and make comparisons where relevant.

Image for topic: The graph below shows the percentage of adults who read books in four different countries between 2010 and 2022. Summarize the information by selecting and reporting the main features, and make comparisons where relevant.
Our system will evaluate the answer based on this AI-generated description.
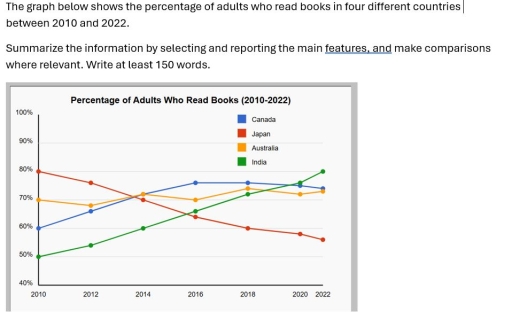
The image displays a line graph titled "Percentage of Adults Who Read Books (2010-2022)" with data for four countries—Canada, Japan, Australia, and India from 2010 to 2022. In 2010, Canada stands at approximately 68%, Japan at 79%, Australia at 70%, and India at 49%. By 2012, figures for Canada rise to 76%, Japan decreases to 74%, Australia increases slightly to 71%, and India jumps to 56%. In 2014, Canada's figure is around 80%, Japan further drops to 68%, Australia remains stable at 72%, and India continues upward to 59%. By 2016, Canada maintains around 80%, Japan dips to 63%, Australia reaches about 74%, and India climbs to 64%. For 2018, Canada achieves 83%, Japan drifts lower to 60%, Australia plateaus at around 74%, and India attains 67%. In 2020, Canada reaches about 87%, Japan falls to 55%, Australia's level stays unchanged at approximately 75%, and India increases to around 69%. Finally, in 2022, Canada peaks at 90%, Japan decreases to 49%, Australia remains somewhat stable at 77%, and India progresses to approximately 71%.
Given the complexity of the image, the above description may not be entirely accurate.
Note: Both the topic and the answer were created by one of our users.

The line graph demonstrates the percentage of who study books in four different countries during 2010 to 2022.

Overall,graph represents the percentage of adults who read books and four lines where first one is decreasing while the last one is increasing gradually and other two are fulctating up and down.

To begin with ,in 2010 Japan accounted for 80% but some how it dropped rapidly till 2018 it reached for 60% and also gradually decreased till 2022 reaching about 50%. While in the other hand,India which started from the least at 50% sky rocketed to its peak same as where Japan began at 80% in 2022.

However, in 2010 Austrilia decreased gradually from 70% to 69% in 2012 and slightly increased in 2014 at 71% after that the percentage flucated up and down and finally, reaching at 71% in 2022 as same as 2012. Likewise,Canada started from 60% rapidly increased for eight years reaching at about 80% at 2016 and seem like slightly decreased for six years reaching at 72% at 2022 at the top of the Austrilian.

Word Count: 178

Answers On The Same Topic:

The graph below shows the percentage of adults who read books in four different countries between 2010 and 2022. Summarize the information by selecting and reporting the main features, and make comparisons where relevant.

The line graph illustrates the percentage of adults who read books in four various countries from 2010 to 2022. Overall, from the statictics, it can be inferred that Indian residents have a dominance result among in this four countries. While, Japan readers of number have less percentage. Looking at the graph, it is obvious that […]

The graph below shows the percentage of adults who read books in four different countries between 2010 and 2022. Summarize the information by selecting and reporting the main features, and make comparisons where relevant.

The line chart illustrates the proportion of mature individuals who read books in Canada, Japan, Australia, and India between 2010 and 2022. Overall, at the beginning of the period, Japan had the highest percentage of book readers, while Canada and Australia showed moderate proportions. By contrast, India had the lowest percentage in 2010, but by […]

The graph below shows the percentage of adults who read books in four different countries between 2010 and 2022. Summarize the information by selecting and reporting the main features, and make comparisons where relevant.

The line chart represents the adults who read books as a percentage in four countries from Canada, Japan, Australia and India over the 12 years from 2010 to 2022. Overall, it is seen that, Indian adults reading books trend line was consistently upward and was the highest, on the other hand, Japanese adults who read […]

See All

Other Topics:

The graph below shows the percentage of people in a European country, by age group, who believed that wearing traditional attire was an important part of their cultural identity between 1990 and 2020.

The line graph illustrates the percentage of people lived in Europe, by five age groups who had a belief that wearing traditional attire had a significant meaning of their cultural identification between 1990 and 2020. Overall, age grops that are older showed higher percentage but gradually declined decade by decade. As for the younger generation […]

The chart below shows the changes in car ownership in Great Britain between 1961 and 2001.

The line graph illustrates the changes in the proportion of households owning cars in Great Britain over a 40-year period from 1961 to 2001. Overall, it is clear that car ownership in Great Britain increased significantly over the period. The percentage of households without a car experienced a sharp decline, while the figures for families […]

The diagram below gives information about the number of parcels delivered by two major mail services companies from 1920 to 2000. Summarise the information by selecting and reporting the main features, and make comparisons where relevant.

The diagram illustrates data about the number of parcels delivered by two major mail service companies between 1920 and 2000. Overall, while Federal Express (FedEx) underwent a period of volatility, TNT mail services experienced an upward trend throughout the period. In addition, the highest number of parcels delivered by both FedEx and TNT was observed […]

The line graph below gives information on cinema attendance in the UK. Summarize the information by selecting and reporting the main features, and make comparisons where relevant. Write at least 150 words.

The provided line chart illustrates the great Britain reports for percentage of people are attending cinema age-by- age Between 1984 to 2003 . Following all Data are increasingly significant over the time . From 1984 to 1988 age fifteen to twenty – four are 18% grown at that time and after that Between 2000 to […]

The chart below shows the percentage of households with different kinds of technology in the UK from 1997 to 2001. Summarise the information by selecting and reporting the main features, and make comparisons where relevant.

The graph compares the percentage of UK households that had access to various types of technology, namely CD player, telephone, computer, and internet as well as DVD player over the period from 1997 to 2001. Overall, it can be seen that all types of compared technology experienced an overall increase. CD player dominated over the […]

The chart below shows the percentage of households with different kinds of technology in the UK from 1997 to 2001. Summarise the information by selecting and reporting the main features, and make comparisons where relevant.

The graph below details the increases of the usage of house item from 1998 to 2001 in the UK. Overall, all the figures showed increases, especially the telephone which had been on of the least preferred and became one of the most useful in the end. While CD represented the highest figures throughout the period, […]

See All
We have detected unusual activity on your device.
Please verify your identity to continue.
Note: This verification step won't sign you in. If you have a premium account, please log in to access the service as usual.
Google/Gmail Verification
Or verify using Email/Code
We've sent a verification code to:
youremail@gmail.com (Not your email?)
Enter it below to complete the verification process.
Ensure your email address is correct, your inbox is not full, and you check your spam folder. If no email arrives, consider using an alternative email.
You will need a Premium plan to perform your action!
Note: If you already have a premium account, please log in to access our services as usual.

Plans & Pricing

Our mission is to make quality education accessible for everyone.
However, to keep our hardworking team running and this service alive, we genuinely need your support!
By opting for a premium plan, not only do you sustain us in achieving the mission, but you also unlock advanced features to enrich your learning experience.

Free

For learners who aren't pressed for time

What's included on Free
100+ Cambridge IELTS Tests
Instant IELTS Writing Task 1 & 2 Evaluation (2 times/month)
Instant IELTS Speaking Part 1, 2, & 3 Evaluation (2 times/month)
Instant IELTS Writing Task 1 & 2 Essay Generator (2 times/month)
500+ Dictation & Shadowing Exercises
100+ Pronunciation Exercises
Flashcards
Other Advanced Tools

Premium

For those serious about advancing their English proficiency, and for IELTS candidates aspiring to boost their band score by 1-2 points (especially in writing & speaking) in just 30 days or less

What's included on Premium
Save Your IELTS Test Progress & Analyze Mistakes By Question Type
Save Your Own Flashcard Sets & Use Them On Any Device
Unlock All Courses, IELTS Tests, Section & Part Practice
Unlimited AI Conversations
Unlimited AI Writing Enhancement Exercises
Unlimited IELTS Writing Task 1 & 2 Evaluation
Unlimited IELTS Speaking Part 1, 2, & 3 Evaluation
Checked Answers Will Not Be Published
Unlimited IELTS Writing Task 1 & 2 Essay Generator
Unlimited IELTS Speaking Part 1, 2, & 3 Sample Generator
Unlimited Usage Of Advanced Tools & AI Features
Priority Support within 24h (12-month plan only)

Due to the nature of our service and the provided free trials, payments are non-refundable.