Our system will evaluate the answer based on this AI-generated description.
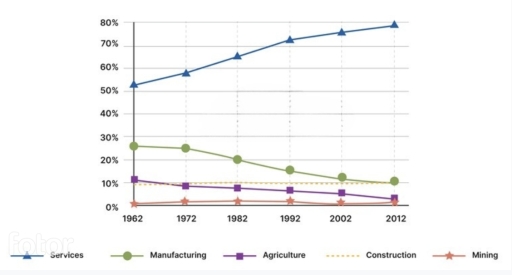
The image shows data trends from 1962 to 2012 for Services, Manufacturing, Agriculture, Construction, and Mining; in 1962, Services at 40%, Manufacturing at 25%, Agriculture at 30%, Construction at approximately 3%, and Mining at 2%; in 1972, Services at 50%, Manufacturing at approximately 21%, Agriculture at 25%, Construction at 2%, and Mining at around 2%; in 1982, Services at 55%, Manufacturing at approximately 15%, Agriculture at 19%, Construction at 2%, and Mining at around 1%; in 1992, Services at 60%, Manufacturing at around 10%, Agriculture at 14%, Construction at approximately 2%, and Mining at around 1%; in 2002, Services at 70%, Manufacturing at approximately 7%, Agriculture at 11%, Construction at 2%, and Mining at less than 1%; in 2012, Services at around 78%, Manufacturing at 6%, Agriculture at 9%, Construction at around 2%, and Mining at less than 1%.
Given the complexity of the image, the above description may not be entirely accurate.
Skyrocket your IELTS band score by 1-2 points in under a month with our premium plan!
Note: Both the topic and the answer were created by one of our users.
The chart depicts the proportion of the workforce in five different industries in Australia over two decades of a period, commencing from 1962.
By and large, what stands out from the graph is the considerable upward trend in the Services’ figure while other categaries experienced a moderate downward trend. It is also notable that, the services’ data was the most popular industry over a ten-year period.
Initially, the percentage of services was the most favourable among other figures. It started at over a half, followed by a sky-rocket which reach its peak at approximately 80% afterwards. On the contrary, the manufacturing’s data observed a slight inclined from under a third to around 10%, which was the third position in 2012.
Similar to manufacturing’s statistic, the agriculture and construction’s data witnessed the same trend, which begun at under 10% in 1962. However, while the argiculture’s figure experienced a marginal decrease , the construction’s data remained unchanged in the end of the period which ended as the least second popular industry. The proportion of mining started at no interest and ended at the bottom-position.
Word Count: 182