Our system will evaluate the answer based on this AI-generated description.
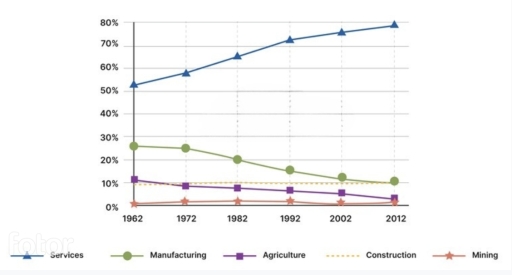
The image shows data trends from 1962 to 2012 for Services, Manufacturing, Agriculture, Construction, and Mining; in 1962, Services at 40%, Manufacturing at 25%, Agriculture at 30%, Construction at approximately 3%, and Mining at 2%; in 1972, Services at 50%, Manufacturing at approximately 21%, Agriculture at 25%, Construction at 2%, and Mining at around 2%; in 1982, Services at 55%, Manufacturing at approximately 15%, Agriculture at 19%, Construction at 2%, and Mining at around 1%; in 1992, Services at 60%, Manufacturing at around 10%, Agriculture at 14%, Construction at approximately 2%, and Mining at around 1%; in 2002, Services at 70%, Manufacturing at approximately 7%, Agriculture at 11%, Construction at 2%, and Mining at less than 1%; in 2012, Services at around 78%, Manufacturing at 6%, Agriculture at 9%, Construction at around 2%, and Mining at less than 1%.
Given the complexity of the image, the above description may not be entirely accurate.
Skyrocket your IELTS band score by 1-2 points in under a month with our premium plan!
Note: Both the topic and the answer were created by one of our users.
The line graph illustrates data about the proportion of Australian workforce in the different industries from 1962 to 2012.
Overall, it is quite evident that the all industries declined throughout the given time period, with exception of services increased.
To begin with, the Australian workforce of construction industries was stable over the year. Following that, the workforce in mining began at 1% in 1962 and it was stable until 2012. The agriculture and manufacturing industries workforce followed decrease and mirror pattern, at starting point at 11% and 26%, respectively in 1962. Subsequently, Agriculture industries of workforce stood just above 2% in 2012, while manufacturing industries workforce was almost stable over the year 1972, and then it gradually decline and picked at 10%, throughout the end of year.
In addition, American workforce of services industries had gradually increase, begin to approximately 51%, and ending the highest at just above 80%, in 2012.
Word Count: 151