Our system will evaluate the answer based on this AI-generated description.
The image displays a line graph with five categories tracking percentage values from 1970 to 2010: Food starts at 35% in 1970, followed by 30% in 1980, 25% in 1990, 20% in 2000, and roughly 15% in 2010; Leisure starts just above 0% in 1970, rises to approximately 5% in 1980, leaps around 10% in 1990, climbs to around 15% in 2000, and stabilizes close to 22% in 2010; Clothing starts just under 20% in 1970, drops to about 15% in 1980, decreases to nearly 12% in 1990, touches 10% in 2000, and ends just above 5% in 2010; Transport maintains at about 10% in 1970, sees a minor decline under 10% by 1980, dips further to almost 8% in 1990, stays constant towards 10% through 2000, and remains just under 10% in 2010; Health starts below 5% in 1970, follows a steady incline reaching slightly above 5% in 1980, aligns closely with Clothing's drop, nearly 8% in 2000 and remains around 9% in 2010.
Given the complexity of the image, the above description may not be entirely accurate.
Skyrocket your IELTS band score by 1-2 points in under a month with our premium plan!
Note: Both the topic and the answer were created by one of our users.
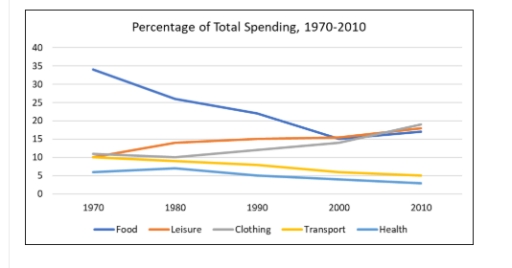
The graph illustrates the data of one Australian city from 1970 to 2010 about the total expenditure in five major categories.
Overall, there was a rapid decrease in spending money on food, where rest of the category shows constant movement.
Above all categories, there was a noticeable change in food. There was a dramatic decrease from the year 1970 to 2000 where it decreased from 34% to 15%. However, the expenses increased a little about 17% in 2010. Moreover, there was a gradual decrease of spending money in transport and health but as like food there was no sign of increase of spending money. For transport and health the total expenditure was 10% and 6% in 1970 and later on 2010 the both category decreased about 5% and 3%.
On the other hand the expenditure on leisure and clothing was quite opposite of the category of transport and health where there was a silent increase and from the year 1970 the spending in leisure and clothing was about 11% and 12%. In 2010 the spending increased about 16% and 17%.
In addition, residents of Australia used to spend most of their income in food but by now the spending on food decreased a lot and more interestingly in 2010 the highest spending category is clothing.
Word Count: 215