Our system will evaluate the answer based on this AI-generated description.
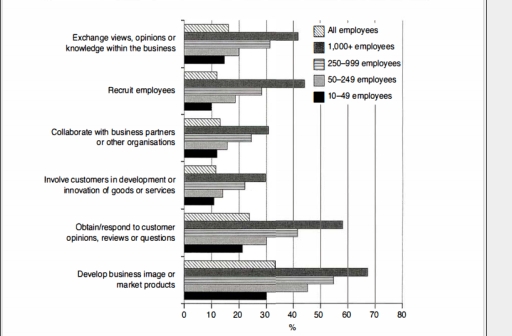
The image presents a horizontal bar chart comparing percentages for six business activities across five employee size categories. For Exchange views, opinions or knowledge within the business: All employees 18%, 1,000+ employees 48%, 250-999 employees 30%, 50-249 employees 20%, and 10-49 employees 15%. For Recruit employees: All employees 19%, 1,000+ employees 52%, 250-999 employees 29%, 50-249 employees 18%, and 10-49 employees 8%. For Collaborate with business partners or other organisations: All employees 16%, 1,000+ employees 37%, 250-999 employees 30%, 50-249 employees 18%, and 10-49 employees 8%. For Involve customers in development or innovation of goods or services: All employees 18%, 1,000+ employees 39%, 250-999 employees 30%, 50-249 employees 19%, and 10-49 employees 9%. For Obtain/respond to customer opinions, reviews or questions: All employees 29%, 1,000+ employees 56%, 250-999 employees 40%, 50-249 employees 30%, and 10-49 employees 20%. For Develop business image or market products: All employees 32%, 1,000+ employees 68%, 250-999 employees 55%, 50-249 employees 40%, and 10-49 employees 21%.
Given the complexity of the image, the above description may not be entirely accurate.
Skyrocket your IELTS band score by 1-2 points in under a month with our premium plan!
Note: Both the topic and the answer were created by one of our users.
The bar chart illustrates the reasons why businesses of different sizes used social media in 2012.
Overall, the use of social media increased with company size. Large companies were far more active than small firms, and the most common purposes across all businesses were developing a business image, marketing products, and responding to customer feedback. By contrast, recruiting employees and internal communication were less common, especially among small companies.
In detail, around 70% of large companies with over 1,000 employees used social media to develop their business image or market products, compared with roughly 30% of firms with 10-49 employees. A similar pattern can be seen in responding to customer opinions, where about 60% of the largest businesses were involved, while the figure for the smallest firms was below 30%.
Collaboration with business partners was also more frequent among larger organisations, at approximately 50%, whereas fewer than 20% of small businesses used social media for this purpose. Exchanging views within the business followed the same trend. Recruiting employees was the least common reason overall, particularly among small firms, although it was still used by a significant proportion of large companies.
Word Count: 190