Our system will evaluate the answer based on this AI-generated description.
The image depicts a line graph of dollars per person spent on Research into Renewable Energy from 1975 to 2000 for 4 countries: Switzerland, Denmark, Spain, and the UK. Data points for Switzerland show a gradual increase from around $1 in 1975, nearing $2 in 1980, surpassing $3 in 1985, reaching approximately $4 in 1990, approximately $5 in 1995, and just below $6 in 2000. Denmark's data illustrate a similar upward trend, starting just above $1 in 1975, approximately $2 in 1980, over $3 in 1985, nearing $4 in 1990, just below $5 in 1995, and reaching $6 in 2000. Spain shows a slower rise, beginning below $1 in 1975, slightly increasing in 1980, nearing $1 in 1985, reaching $2 in 1990, nearly $3 in 1995, and barely crossing $3 in 2000. The UK's data points display a steady increment, just below $1 in 1975, over $1 in 1980, almost at $2 in 1985, above $2 in 1990, nearing $3 in 1995, and touching $4 in 2000. All four countries exhibit growth in spending, with Denmark and Switzerland showing the highest expenditure per person and Spain the lowest by 2000.
Given the complexity of the image, the above description may not be entirely accurate.
Skyrocket your IELTS band score by 1-2 points in under a month with our premium plan!
Note: Both the topic and the answer were created by one of our users.
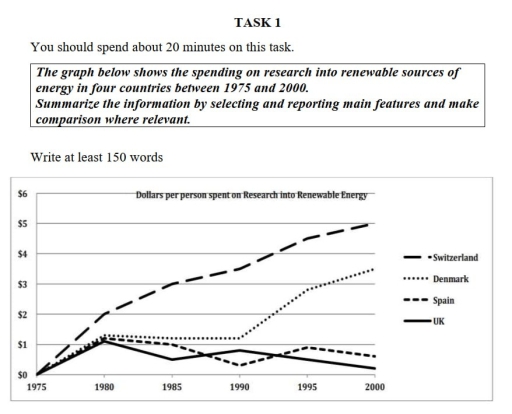
The graph depicts information regarding the expenditures of countries on research into renewable energy sources within the year of 1975 to 2000.
It is prominent that Switzerland invested the most in this research during those four centuries. In fact, the dollars per person spent increase continuously. In stark contrast, UK spent the least in this matter. The numbers were consistent throughout the years, at a dollar, with slight volatility during 1980-1990.
On the other hand, dollars per person spent on Denmark and Spain were relatively similar. Each individual in the country expend approximately $1,2 within the 5 year period from 1980 to 1985. However, there was a substantial change of pattern in the following years. Denmark invested far more rigorously. At its peak, it reached $3,5. Meanwhile Spain’s approach throughout the years remain generally stable.
All in all, each countries have their own distinguished pattern in investing on sustainable energy. Some have a relatively aggresive approach, while others tend to be more moderate.
Word Count: 163