Our system will evaluate the answer based on this AI-generated description.
The image displays a bar graph demonstrating the age distribution of Iceland's population from 1990 to 2020 in five-year increments, with five age ranges represented by distinct colors. In 1990, ages 0-14 accounted for approximately 30%, ages 15-24 constituted about 15-20%, ages 25-54 comprised around 45%, ages 55-64 made up roughly 8%, and ages 65 and over occupied about 10%. In 2000, ages 0-14 decreased to about 25%, ages 15-24 remained around 15-20%, ages 25-54 increased to almost 50%, ages 55-64 stayed at 8%, and ages 65 and over rose to nearly 12%. In 2010, ages 0-14 further dropped to approximately 20%, ages 15-24 stayed around 15-20%, ages 25-54 decreased to about 45%, ages 55-64 increased to nearly 10%, and ages 65 and over climbed to almost 15%. Lastly, in 2020, ages 0-14 stayed at 20%, ages 15-24 remained around 15-20%, ages 25-54 decreased to roughly 40%, ages 55-64 increased to around 12%, and ages 65 and over rose to roughly 20%.
Given the complexity of the image, the above description may not be entirely accurate.
Skyrocket your IELTS band score by 1-2 points in under a month with our premium plan!
Note: Both the topic and the answer were created by one of our users.
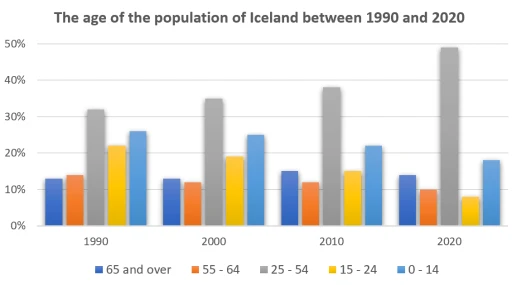
The graph given below provides some information about the age of the population of Iceland between 1990 and 2020.
Overall, the number of the 25-54 age group increased the life period, while others younger ages decreased over the period.
At the beginning of the year, the group of the 25-54 ages whole people was approximately 32%,while the rate for 2020 was higher at 48%.Through the from 2000 to 2010, during this period in 10 years it increased double stable half an over.
When it comes to other group of ages people, we can see that there was 2 older groups.The number of 65 and over age group stayed constant apart from 2010 years,İt was a little bit go up around 15%.Another size of the 55-64 age group dropped 15% to 10%.
Turning to the younger ages of two groups 15-24 and 0-14, indicates shown us there was decreased in the figure for each group plunged.The 15-24 age group fell 20 to 10% the 30years.Then the 0-14 age group dropped from just over 25% in 1990 to just under 20%in 2020.
Word Count: 180
