Our system will evaluate the answer based on this AI-generated description.
The image displays a line graph illustrating the number of visitors to Cardiff and Dublin from 2011 to 2020. In 2011, Cardiff had 2 million visitors which dropped to just under 2 million in 2012, then increased to slightly over 2 million in 2013, and slightly decreased below 2 million in 2014. In 2015, visitors to Cardiff rose to approximately 2.2 million, dropped back just under 2 million in 2016 and 2017, and increased to 2 million in 2018. Cardiff saw a sharp rise in visitors to approximately 4 million in 2019, followed by a small decrease in 2020.
For Dublin, visitors started at just over 3 million in 2011, slightly dipped in 2012, and rose to nearly 3.5 million in 2013. The numbers dropped below 3 million in 2014, increased again to nearly 3.5 million in 2015, and remained stable in 2016. However, there was a sharp increase to about 5 million visitors in 2017. In 2018, the number of visitors to Dublin decreased slightly to just below 5 million but surged again to more than 5.5 million in 2019 and 2020.
Given the complexity of the image, the above description may not be entirely accurate.
Skyrocket your IELTS band score by 1-2 points in under a month with our premium plan!
Note: Both the topic and the answer were created by one of our users.
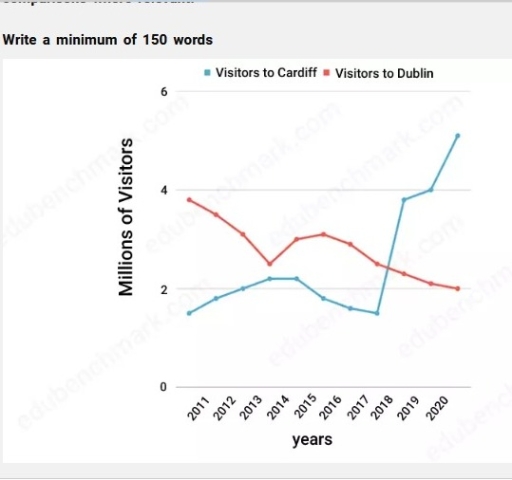
The chart illustrates the number of tourists who visited two destinations, Cardiff and Dublin, from 2011 to 2020.
Overall, it is clear that the number of visitors to Cardiff increased significantly towards the end of the period, while the number of visitors to Dublin saw a slight decrease.
In 2011, Dublin was the most popular destination, at around 3.9 million visitors, compared to about 1.7 million in Cardiff. Over the next three years, the number of tourists visiting Dublin declined gently, reaching approximately 2.3 million in 2014. This figure then showed a negligible increase until 2016, after that gradually fell towards the end of the period.
In contrast, the number of visitors to Cardiff remained stable at around 2.2 million in 2014 and 2015. It then experienced a slight decline, falling from approximately 1.7 million to 1.6 million between 2015 and 2017. However, the figure increased dramatically in 2018 and reached a peak at the end of the period, when it stood at 5.6 million.
Word Count: 165