🔥 Today Only: Save 30% on Premium — Offer Ends Soon! - Upgrade Now!
Bar Chart

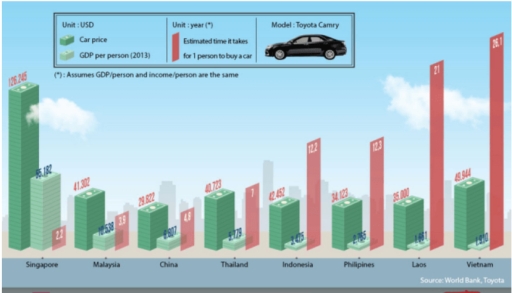
Band 6+: The graph illustrates the relationship between the GDP per capita, the cost of a Toyota Camry, and the estimated duration for an individual citizen to afford purchasing that vehicle in eight Asian nations. Summarise the information by selecting and reporting the main features, and make comparisons where relevant.

Image for topic: The graph illustrates the relationship between the GDP per capita, the cost of a Toyota Camry, and the estimated duration for an individual citizen to afford purchasing that vehicle in eight Asian nations. Summarise the information by selecting and reporting the main features, and make comparisons where relevant.
Our system will evaluate the answer based on this AI-generated description.
The image displays a bar graph labelled with eight countries and three different measurements; car price in USD, GDP per person (2013) in USD, and estimated time in years for one person to buy a car, represented by bars in varying heights. The car model is a Toyota Camry. The data reads as follows: Singapore - car price $110,760, GDP per person $55,182, time 2; Malaysia - car price $51,217, GDP per person $10,538, time 5; China - car price $41,894, GDP per person $6,807, time 6; Thailand - car price $40,508, GDP per person $5,779, time 7; Indonesia - car price $35,768, GDP per person $3,475, time 10; Philippines - car price $37,391, GDP per person $2,765, time 14; Laos - car price $44,322, GDP per person $1,660, time 27; Vietnam - car price $51,484, GDP per person $1,890, time 27. There's a note that states "(*) Assumes GDP/person and income/person are the same".
Given the complexity of the image, the above description may not be entirely accurate.
Note: Both the topic and the answer were created by one of our users.

The bar chart illustrates three figures, the GDP per person in 2013, the cost of one Toyota Camry, and the approximate number of years for one resident to be able to purchase that automobile.

Overall, the list of countries that were interviewed are Singapore, Malaysia, China, Thailand, Indonesia, Philippines, Laos and Vietnam, respectively. Besides Singapore, the average amount of money every person made from every nation listed above was between 34.000 USD and 50.000 USD.

Singapore had the most significant statistics in the chart, with the highest car price and the Gross Domestic Product, whereas having the lowest amount of time to have a person obtain a Toyota Camry. In contrast, due to the fact the fee for one car was placed second in the chart, with the price of 49,944 USD per car, the period of time for one Vietnamese to own a automobile was the remarkably longest. In addition, Laos is placed second for the longest amount of time to possess a car, and the country to have the lowest GDP per unit of population.

Word Count: 177

Answers On The Same Topic:

The graph illustrates the relationship between the GDP per capita, the cost of a Toyota Camry, and the estimated duration for an individual citizen to afford purchasing that vehicle in eight Asian nations. Summarise the information by selecting and reporting the main features, and make comparisons where relevant.

The bar graph illustrates the differences of the income per person , price of a Toyota Camry and time for a person to buy that transport mode in 8 south east asia cointries. Cost of the Toyota Camry in Asian countries don’t have a enormous differece, 7 out of 8 countries are in range between […]

The graph illustrates the relationship between the GDP per capita, the cost of a Toyota Camry, and the estimated duration for an individual citizen to afford purchasing that vehicle in eight Asian nations. Summarise the information by selecting and reporting the main features, and make comparisons where relevant.

The graph compares the GDP per capita, cost of a Toyota Camry and approximate length of time it takes for 1 citizen to purchase that mode of transport in eight Asian countries. Despite having the second lowest average yearly income, it costs more to buy this car in Vietnam than in all but one other […]

The graph illustrates the relationship between the GDP per capita, the cost of a Toyota Camry, and the estimated duration for an individual citizen to afford purchasing that vehicle in eight Asian nations. Summarise the information by selecting and reporting the main features, and make comparisons where relevant.

The graph illustrates the prices of a Toyota car and the per person GDP in different countries, alongwith the approximate number of years it takes for an individual to purchase it. Despite of costing a staggering $126000, Singaporeans were able to purchase the car in only about 2.2 years due to their high income in […]

The graph illustrates the relationship between the GDP per capita, the cost of a Toyota Camry, and the estimated duration for an individual citizen to afford purchasing that vehicle in eight Asian nations. Summarise the information by selecting and reporting the main features, and make comparisons where relevant.

The graph compares the data of buying a Toyota Camry model car in different south east asian countries using various measuring points like car price, GDP per person and the time it takes for a person to buy a car. First of all, let us talk about the car price. It is interesting to note […]

The graph illustrates the relationship between the GDP per capita, the cost of a Toyota Camry, and the estimated duration for an individual citizen to afford purchasing that vehicle in eight Asian nations. Summarise the information by selecting and reporting the main features, and make comparisons where relevant.

The graph compares the GDP per capita, cost of a Toyota Camry and approximate length of time it takes for 1 citizen to purchase that mode of transport in eight Asian countries. Despite having the second lowest average yearly income, it costs more to buy this car in Vietnam than in all but one other […]

See All

Other Topics:

The graph below shows the percentage of self employed workers of the total workforce in five countries in 1998 and 2008.

The bar graph illustrates the percentage of self employed workers of the total workforce in five countries between 1998 and 2008. Overall, it can be seen that there were some noticeable changes. Turkey was the most popular category, while Russian Republice recorded lowest figure. Looking at the details, in 1998, the proportion of self employed […]

The chart below shows sales of three categories of magazine in a particular region over five weeks.

The bar chart illustrates the sales of three different types of magazines in a particular region over a five-week period. Overall, the sports magazine had the highest sales throughout the period, while sales of the fashion and music magazines showed a recovery and a gradual increase, respectively. The sports magazine recorded by far the highest […]

The chart compares the number of people per household by percentage in the UK in 1981 and 2001.

The given graph shows the proportion of people in relation to each household in the UK in the years 1981 and 2001. Overall, while more people lived as more extended communities in accommodations in 1981, two decades later, these numbers of individuals per house decreased noticeably. In both years, in 1981 and 2001, the large […]

The chart below illustrates the percentage of British households that had various items in 2001 and 2008.

The bar chart illustrates the proportion of domestic units in one country that had eight different types of goods between 2001 and 2008. Overall, the telephone had higher percentages in both years rather than other goods, while microwave and CD player users showed similar proportions with telephone in 2008. Mobile phone, internet, and dishwasher were […]

The chart shows the percentage of household expenditure on goods and services in a country from 1995 to 2005. Summarise the information by selecting and reporting the main features and make comparisons where relevant.

The bar chart illustrates the proportion of spending money for goods and services in a country between 1995 and 2005. Overall, it is evident that spending money for housing and food and drinks had the highest figure in two separate years, while transport also exhibited the least figure in the same period. In 1995, housing […]

The chart below shows information about calorie consumption in seven countries in 1975 and 2000. Summarise the information by selecting and reporting the main features, and make comparisions where relevant.

The given bar chart provides details on the amount of calories consumed in seven different countries in 1975 and 2000. Overall, there is an increase in calorie consumption across all nations. In countries such as Bangladesh and Pakistan, the calorie intake only grew marginally. However, in China and Indonesia consumption rose significantly. The number of […]

See All
We have detected unusual activity on your device.
Please verify your identity to continue.
Note: This verification step won't sign you in. If you have a premium account, please log in to access the service as usual.
Google/Gmail Verification
Or verify using Email/Code
We've sent a verification code to:
youremail@gmail.com (Not your email?)
Enter it below to complete the verification process.
Ensure your email address is correct, your inbox is not full, and you check your spam folder. If no email arrives, consider using an alternative email.
You will need a Premium plan to perform your action!
Note: If you already have a premium account, please log in to access our services as usual.

Plans & Pricing

Our mission is to make quality education accessible for everyone.
However, to keep our hardworking team running and this service alive, we genuinely need your support!
By opting for a premium plan, not only do you sustain us in achieving the mission, but you also unlock advanced features to enrich your learning experience.

Free

For learners who aren't pressed for time

What's included on Free
100+ Cambridge IELTS Tests
Instant IELTS Writing Task 1 & 2 Evaluation (2 times/month)
Instant IELTS Speaking Part 1, 2, & 3 Evaluation (2 times/month)
Instant IELTS Writing Task 1 & 2 Essay Generator (2 times/month)
500+ Dictation & Shadowing Exercises
100+ Pronunciation Exercises
Flashcards
Other Advanced Tools

Premium

For those serious about advancing their English proficiency, and for IELTS candidates aspiring to boost their band score by 1-2 points (especially in writing & speaking) in just 30 days or less

What's included on Premium
Save Your IELTS Test Progress & Analyze Mistakes By Question Type
Save Your Own Flashcard Sets & Use Them On Any Device
Unlock All Courses, IELTS Tests, Section & Part Practice
Unlimited AI Conversations
Unlimited AI Writing Enhancement Exercises
Unlimited IELTS Writing Task 1 & 2 Evaluation
Unlimited IELTS Speaking Part 1, 2, & 3 Evaluation
Checked Answers Will Not Be Published
Unlimited IELTS Writing Task 1 & 2 Essay Generator
Unlimited IELTS Speaking Part 1, 2, & 3 Sample Generator
Unlimited Usage Of Advanced Tools & AI Features
Priority Support within 24h (12-month plan only)

Due to the nature of our service and the provided free trials, payments are non-refundable.