🔥 Today Only: Save 30% on Premium — Offer Ends Soon! - Upgrade Now!
Line Graph

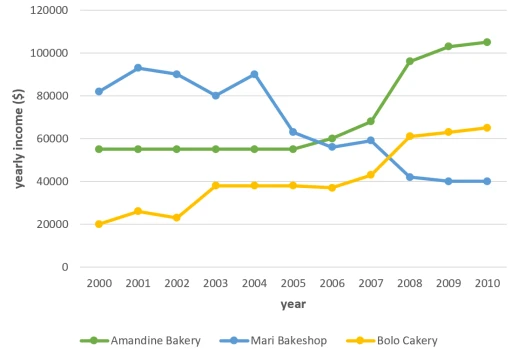
Band 7+: The graph shows data about the annual earnings of three bakeries in Calgary, 2000-2010.

Image for topic: The graph shows data about the annual earnings of three bakeries in Calgary, 2000-2010.
Our system will evaluate the answer based on this AI-generated description.
The image depicts a line graph showing the yearly income of three different bakeries from 2000 to 2010. Amandine Bakery is represented by a green line, Mari Bakeshop by a blue line, and Bolo Cakery by a yellow line. Amandine Bakery's income starts at around $55,000 in 2000, decreases slightly to around $53,000 in 2001, jumps to around $85,000 in 2002, remains steady until 2005, dips to around $83,000 in 2006, then steadily increases to reach its peak of around $105,000 in 2009 before dipping to around $100,000 in 2010. Mari Bakeshop's income starts at around $45,000 in 2000, steadily increases to around $50,000 in 2002, drops to around $45,000 in 2003, jumps to around $65,000 in 2004, decreases to around $63,000 in 2005, then steadily increases to reach its peak of around $85,000 in 2009 before decreasing slightly to around $80,000 in 2010. Bolo Cakery's income starts at around $30,000 in 2000, steadily increases to around $40,000 in 2004, jumps to around $50,000 in 2005, then steadily increases to reach its peak of around $70,000 in 2009 before decreasing slightly to around $68,000 in 2010.
Given the complexity of the image, the above description may not be entirely accurate.
Note: Both the topic and the answer were created by one of our users.

The line graph provides an overview of the annual earnings of three distinct bakeries located in Calgary from the year 2000 to 2010.

Overall, all three bakeries witnessed fluctuations in their annual incomes over the specified period. Amandine Bakery initially ranked second, eventually surpassing the other two bakeries in terms of earnings. Mari Bakeshop, starting with the highest revenue in 2000, experienced a decline, while Bolo Cakery showed a consistent growth in income throughout the years.

In the given timeframe, Mari Bakeshop led in earnings in 2000 with over $80,000, followed by Amandine Bakery and Bolo Cakery with significantly lower revenues. The ranking remained consistent until 2006. Subsequently, Mari Bakeshop’s income witnessed a declining trend, while Bolo Cakery closed the earnings gap with its competitors. Notably, in 2008, Amandine Bakery experienced a substantial increase in revenue, outperforming the other bakeries by around $40,000. By 2010, Amandine Bakery emerged as the most profitable, exceeding $100,000 in earnings for two consecutive years.

Over the decade, Bolo Cakery and Amandine Bakery exhibited consistent income growth annually, in contrast to Mari Bakeshop, which experienced a decline in popularity amongst customers. The year 2006 marked a period of relatively equal standing among all three bakeries regarding their annual revenues.

Word Count: 204

Answers On The Same Topic:

The graph shows data about the annual earnings of three bakeries in Calgary, 2000-2010.

The line graph presented details the annual revenues of three distinct bakeries in Calgary from 2000 to 2010, specifically Amandine Bakery, Mari Bakeshop, and Bolo Cakery. Overall, Amandine Bakery and Bolo Cakery demonstrated a consistent upward trend in annual income, while Mari Bakeshop experienced fluctuations, culminating in a notable decrease by the end of the […]

The graph shows data about the annual earnings of three bakeries in Calgary, 2000-2010.

The graph illustrates the earnings of three bakeries in Calgary over a ten-year period from 2000 to 2010. Overall, it is evident from the graph that both Bolo Cakery and Amandine Bakery experienced significant upward trends in their income, while Mari Bakeshop saw a substantial decline during the same period. Interestingly, Mari Bakeshop was the […]

The graph shows data about the annual earnings of three bakeries in Calgary, 2000-2010.

The line graph illustrates the yearly profits of three bakeries in Calgary—Amandine, Bolo, and Mari—from 2000 to 2010. Overall, Amandine Bakery experienced a significant increase in profit, Bolo Bakery showed steady growth, and Mari Bakeshop saw a downturn over the decade. In 2000, Mari Bakeshop had the highest earnings at approximately $81,000, followed by Amandine […]

The graph shows data about the annual earnings of three bakeries in Calgary, 2000-2010.

The line graph presents the data about the amount of money which was earned by three bakeries in Calgary, over a ten-year period between 2000 and 2010. Overall, Mari Bakeshop experienced the most significant variability in yearly income. Amandine Bakery, in the other hand, commenced with minor variants, but ended the year with the highest […]

The graph shows data about the annual earnings of three bakeries in Calgary, 2000-2010.

The line chart illustrates the yearly revenue of three bakeries in Calgary between 2000 and 2010. Overall, Amandine Bakery and Bolo Cakery showed a gradual increase in their revenue, while Mari Bakeshop experienced a significant decline during this period. Although Mari Bakeshop was the most popular at the beginning of 2000, Amandine Bakery eventually surpassed […]

See All

Other Topics:

The line graph shows distance covered in a 100-kilometer race between a tortoise and a hare.

The line graph illustrates the distance achieved over time in a 100-kilometer race between tortoise and a hare. Overall, the graph shows that a tortoise lead over a hare while the competition. In the begining a hare was very fast and covered 60 km distance from 0 to 4 hours. After that, the velocity of […]

The line graph shows distance covered in a 100-kilometer race between a tortoise and a hare.

The line graph illustrates the distance achieved over time in a 100-kilometer race between tortoise and a hare. Overall, the graph shows that a tortoise lead over a hare while the competition. In the begining a hare was very fast and covered 60 km distance from 0 to 4 hours. After that, the velocity of […]

The Graph shows information about the number of marriages in the UK from 1951 to 2001

The line graph illustrates the account of marraiages status in the united kingdom from 1951 to 2001.measured by thousands,there has three catagories: All marriages, Remarriages and First marriages. Overall,it can be seen that in 1981 was the maximum number of marriages and Remarriage. whereas in 2001 was the lowest number of marriage and Remarriage. Approximately, […]

The line graph shows the percentage of people in the UK with access to different types of recreational activities from 1996 to 2006.

The graph illustrates percentage of access to different types of recreational activities within the people in the UK. Overall, all types of activities experienced growth over the given period. Although, going to gym showed the most significant leap. Regarding 3 out of 4 recreational ativities: watching TV, listening to music and reading books experienced similar […]

The line graph shows the percentage of people in the UK with access to different types of recreational activities from 1996 to 2006.

The graph illustrates percentage of access to different types of recreational activities within the people in the UK. Overall, all types of activities experienced growth over the given period. Although, going to gym showed the most significant leap. Regarding 3 out of 4 recreational ativities: watching TV, listening to music and reading books experienced similar […]

The line graph shows distance covered in a 100-kilometer race between a tortoise and a hare.

the line graph presents distance travelled in a 100-kilometer race between a tortoise and a hare. overall, the garph shows that at the beginning both the hare and the torotoise were going at an equal distance. but, after a while the hare overtook the tortoise and sped up after that, the hare took a nap […]

See All
We have detected unusual activity on your device.
Please verify your identity to continue.
Note: This verification step won't sign you in. If you have a premium account, please log in to access the service as usual.
Google/Gmail Verification
Or verify using Email/Code
We've sent a verification code to:
youremail@gmail.com (Not your email?)
Enter it below to complete the verification process.
Ensure your email address is correct, your inbox is not full, and you check your spam folder. If no email arrives, consider using an alternative email.
You will need a Premium plan to perform your action!
Note: If you already have a premium account, please log in to access our services as usual.

Plans & Pricing

Our mission is to make quality education accessible for everyone.
However, to keep our hardworking team running and this service alive, we genuinely need your support!
By opting for a premium plan, not only do you sustain us in achieving the mission, but you also unlock advanced features to enrich your learning experience.

Free

For learners who aren't pressed for time

What's included on Free
100+ Cambridge IELTS Tests
Instant IELTS Writing Task 1 & 2 Evaluation (2 times/month)
Instant IELTS Speaking Part 1, 2, & 3 Evaluation (2 times/month)
Instant IELTS Writing Task 1 & 2 Essay Generator (2 times/month)
500+ Dictation & Shadowing Exercises
100+ Pronunciation Exercises
Flashcards
Other Advanced Tools

Premium

For those serious about advancing their English proficiency, and for IELTS candidates aspiring to boost their band score by 1-2 points (especially in writing & speaking) in just 30 days or less

What's included on Premium
Save Your IELTS Test Progress & Analyze Mistakes By Question Type
Save Your Own Flashcard Sets & Use Them On Any Device
Unlock All Courses, IELTS Tests, Section & Part Practice
Unlimited AI Conversations
Unlimited AI Writing Enhancement Exercises
Unlimited IELTS Writing Task 1 & 2 Evaluation
Unlimited IELTS Speaking Part 1, 2, & 3 Evaluation
Checked Answers Will Not Be Published
Unlimited IELTS Writing Task 1 & 2 Essay Generator
Unlimited IELTS Speaking Part 1, 2, & 3 Sample Generator
Unlimited Usage Of Advanced Tools & AI Features
Priority Support within 24h (12-month plan only)

Due to the nature of our service and the provided free trials, payments are non-refundable.