Our system will evaluate the answer based on this AI-generated description.
The image depicts a line graph showing the yearly income of three different bakeries from 2000 to 2010. Amandine Bakery is represented by a green line, Mari Bakeshop by a blue line, and Bolo Cakery by a yellow line. Amandine Bakery's income starts at around $55,000 in 2000, decreases slightly to around $53,000 in 2001, jumps to around $85,000 in 2002, remains steady until 2005, dips to around $83,000 in 2006, then steadily increases to reach its peak of around $105,000 in 2009 before dipping to around $100,000 in 2010. Mari Bakeshop's income starts at around $45,000 in 2000, steadily increases to around $50,000 in 2002, drops to around $45,000 in 2003, jumps to around $65,000 in 2004, decreases to around $63,000 in 2005, then steadily increases to reach its peak of around $85,000 in 2009 before decreasing slightly to around $80,000 in 2010. Bolo Cakery's income starts at around $30,000 in 2000, steadily increases to around $40,000 in 2004, jumps to around $50,000 in 2005, then steadily increases to reach its peak of around $70,000 in 2009 before decreasing slightly to around $68,000 in 2010.
Given the complexity of the image, the above description may not be entirely accurate.
Skyrocket your IELTS band score by 1-2 points in under a month with our premium plan!
Note: Both the topic and the answer were created by one of our users.
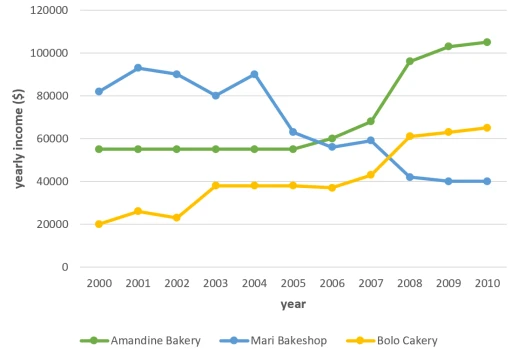
The line graph presents the data about the amount of money which was earned by three bakeries in Calgary, over a ten-year period between 2000 and 2010.
Overall, Mari Bakeshop experienced the most significant variability in yearly income. Amandine Bakery, in the other hand, commenced with minor variants, but ended the year with the highest increment. Bolo cakery yearly income exhibited a pattern of fluctuations with remarkable surge.
Mari Bakeshop recorded substantial drop from 90000 in 2004 to 40000 in the 2010. On the contrary, Amandine Bakery yearly income commended on a descending trajectory, with a slight recovery from 2005 to 2007. Notably, there was a significant increase from 2007 to 2010, what lead to the largest annual increase.
In contrast Bolo Cakery started the year with the lowest annual revenue of 20 000 in 2000, but in period from 2003 to 2006 demonstrate descending trajectory. Subsequently in 2007 to 2010 illustrates big recovery.
Word Count: 154