Our system will evaluate the answer based on this AI-generated description.
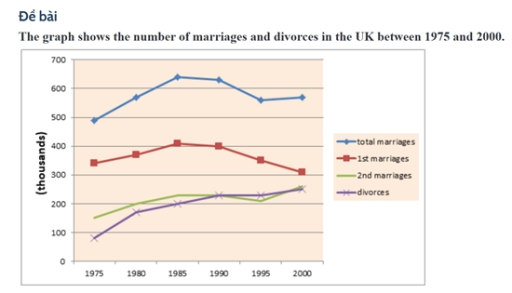
The image features a line graph detailing the number of total marriages, first marriages, second marriages, and divorces in the UK from 1975 to 2000. For 1975, total marriages stand at 400,000, first marriages at 340,000, second marriages at approximately 60,000, and divorces around 130,000. In 1980, total marriages rise to about 480,000, first marriages to around 400,000, second marriages remain near 60,000, and divorces increase slightly to about 140,000. By 1985, total marriages decrease to approximately 380,000, first marriages drop to around 290,000, second marriages increase to about 80,000, and divorces rise to 160,000. In 1990, total marriages are around 340,000, first marriages at 250,000, second marriages rise again to 90,000, and divorces reduce marginally to 150,000. For 1995, the figures are 280,000 for total marriages, 230,000 for first marriages, nearly 95,000 second marriages, and divorces drop to about 140,000. In the year 2000, total marriages continue to decrease to 260,000, first marriages to 200,000, second marriages slightly decrease to about 90,000, and divorces settle around 140,000.
Given the complexity of the image, the above description may not be entirely accurate.
Skyrocket your IELTS band score by 1-2 points in under a month with our premium plan!
Note: Both the topic and the answer were created by one of our users.
The line graph illustrates trends in the number of total marriage, first marriage, seconde marriage and divorces in the UK over a 25-year period, spanning from 1975 to 2000.
Overall, there was a significant fluctuation among categories throughout the duration of the research. While total marriages were dominant trend in 1975, first marriages were dropping rapidly last two years. Unlike, first and total marriages, trend in the number of second marriages and divorces were identical in 1990
In 1975, the number of total marriages remained at approximately 500, which was considerably higher than near 350 for first marriages. However, both trends increased rapidly from 1975 to 1985. Despite of a rise, trend in first marriage showed a sharp decline for the reminder of the period, while total marriages dropped to under 500. By 2000, indicator of total marriages climbed to reach a peak of slightly over 500.
At the begining of the study, the number of divorces recorded as approximately 100, which was a small trend history of research. While, indicator of second marriage reached at 150 in 1975, there were a dramatic increase of in divorces, starting 1980 to 1990. The line graph showed identical trends for both second marriages and divorces in 1990 and 2000.
Word Count: 207
