Our system will evaluate the answer based on this AI-generated description.
The image is a line graph titled "Number of tourists visiting the Galapagos Islands (2015 - 2022)" with three lines representing different categories of tourists - Visitors staying on cruise ships, Visitors staying on island, and Total visitors. The y-axis shows Millions of visitors ranging from 0 to 4, in increments of 0.8, and the x-axis represents the years from 2015 to 2022. In 2015, cruise ship visitors were approximately 0.7 million, island visitors were about 0.3 million, adding up to a total of 1 million. By 2022, the trend projected is cruise ship visitors just above 1.6 million, island visitors near 1.2 million, totaling pretty close to 2.8 million visitors. Each year shows a steady increase with cruise ship visitors always surpassing island visitors, and the total line consistently rising over the years with a slight plateau between 2019 and 2020.
Given the complexity of the image, the above description may not be entirely accurate.
Skyrocket your IELTS band score by 1-2 points in under a month with our premium plan!
Note: Both the topic and the answer were created by one of our users.
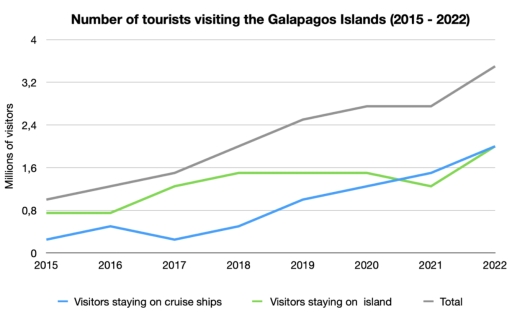
The graph shows the number of tourists visiting the Galapagos Islands between 2015 and 2022. Summarize the information by selecting and reporting the main features, and make comparisons where relevant. To zoom in, click on the image.
The line graph illustrates the three types of visitors: staying on cruise ships,staying on Island and total tourists in Galapagos Islands from 2015 to 2022.
Overall, the number of visitors staying on cruise ships increased almost 5 times between 2015 and 2022,at the same time visitors staying on island reached the same level.Total was rose dramatically from around 1million to 3,5 millions over the period between 2025 and 2022.
The number of tourists staying on cruise grew slowly between 2015 and 2016,from 0.4 to 0.5, then it had minor drop in 2017.By 2022 this statistic hit the highest point.
In contrast,the number of tourists staying on the island stabilised between 2015 and 2016,by 2016 and 2020 sharply soared. In 2022 tourists staying on cruise climbed to a maximum.
Word Count: 165