Our system will evaluate the answer based on this AI-generated description.
The image displays a line graph titled "Museum visitors" with the x-axis showing years from 1980 to 2015 in intervals of 5 and the y-axis showing visitor numbers from 0 to 10,000 in intervals of 2,000. There are four lines representing different museums: the Hermitage with a dotted line, Egyptian Museum with a dashed line, Tokyo National Museum with a solid bold line, and National Museum of Anthropology with a fine solid line. The Hermitage line starts just above 2,000 in 1980 and ends just below 10,000 in 2015, showing a steady increase with slight fluctuations. The Egyptian Museum line starts around 1,500 in 1980 and ends above 8,000 in 2015, showing a steeper increase with some fluctuations. The Tokyo National Museum line starts just below 2,000 in 1980 and ends over 6,000 in 2015, with a gradual increase and some periods of stability. The National Museum of Anthropology line starts just above 6,000 in 1980 and ends just below 4,000 in 2015, showing a decline with minor fluctuations.
Given the complexity of the image, the above description may not be entirely accurate.
Skyrocket your IELTS band score by 1-2 points in under a month with our premium plan!
Note: Both the topic and the answer were created by one of our users.
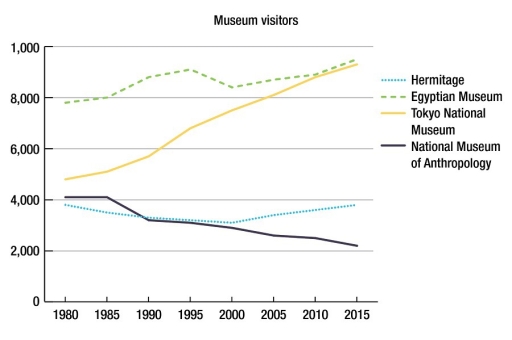
The provided line graph depicts how many people visited four different global museums from 1980 to 2015.
In general, it is clear that the number of visitors for two out of four places witnessed an upward trend, while the others were reverse. In addition, the highest figure can be seen in Egypt’s tourists during the period of time.
In 1980, the Egyptian Museum was chosen to be the tourist attraction of around 7900 travelers, at which point this figure started to increase sharply to 9000 in 1995. After experiencing a slight decrease of around 800 in 2000, it surged back to the previous point and even peaked at 9800 in 2015. This was followed by the Tokyo National Museum, which started at just under 5000 in the first year. Over the years, it increased dramatically and followed closely to the highest figure, with popularity reaching approximately 9700 tourists.
At the starting point, the number of visitors to the Nation Museum of Anthropology and the Hermitage was about 4000 and 3900, respectively. From that time on, the former saw a sustained decline and hit the bottom at over 2000 in 2015, significantly lower than the first year. During the same period, the figure of Hermitage fluctuated between 3900 and 3000, ending at 3900 in the final year.
Word Count: 216
