Our system will evaluate the answer based on this AI-generated description.
The image is a line graph representing percentages over time, from 2001 to 2051, of three categories: Education, Medical care, and Pension. In 2001, Education starts at approximately 10%, Medical care at 14%, and Pension at 6%; by 2011, Education decreases to below 6%, Medical care increases to nearly 16%, and Pension to over 8%; in 2021, Education is at 4%, Medical care at 18%, and Pension at 10%; by 2031, Education remains at 4%, Medical care approaches 20%, and Pension increases to 12%; in 2041, Education slightly increases to 6%, Medical care exceeds 20%, and Pension reaches approximately 14%; finally, in 2051, Education continues at 6%, Medical care is above 22%, and Pension is at 16%. The lines for Education and Medical care intersect between 2001 and 2011, while the Pension line gradually increases without intersection.
Given the complexity of the image, the above description may not be entirely accurate.
Skyrocket your IELTS band score by 1-2 points in under a month with our premium plan!
Note: Both the topic and the answer were created by one of our users.
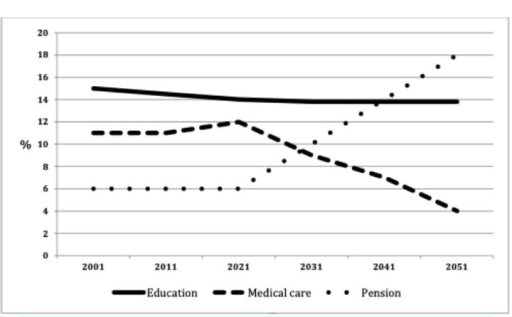
The line graph represents the information about the difference between spending on education, medical care and pension from 2001 to 2051 in an unnamed country. The data reveals a clear relationship between the growth in pension and the decreasing amount of money endowed by country to medical care.
The percentage of spending on pension grew dramatically in 2021, climbing to 12% and is expected to increase to 18% by 2051. From 2001 to 2021 the amount of money spending on pension and medical care was stable and didn’t changed until 2021, when the outgoings on medical care reached a peak in 2021, however suddenly plummeted and is expected to decrease significantly each year until 2051 from 12% to 4%.
The spending on education slightly decreased from approximately 15% to 14% during the period between 2001 and 2021 and is expected to be stable from 2021 to 2051.
Word Count: 147
