Our system will evaluate the answer based on this AI-generated description.
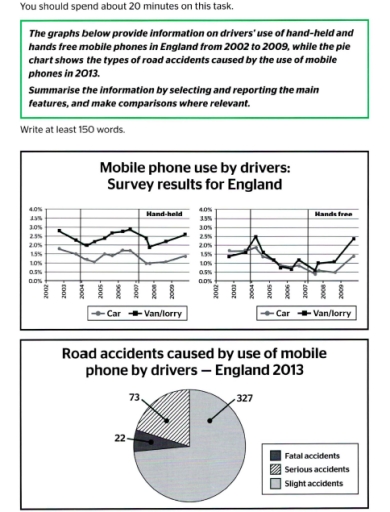
The image includes two line graphs and one pie chart. The first line graph shows "Mobile phone use by drivers: Survey results for England" detailing hand-held mobile phone use (2002: Car 2.3%, Van/lorry 0.5%; 2003: Car 2.8%, Van/lorry 0.5%; 2004: Car 2.8%, Van/lorry 0.7%; 2005: Car 2.4%, Van/lorry 0.8%; 2006: Car 2.5%, Van/lorry 1.0%; 2007: Car 2.6%, Van/lorry 1.7%; 2008: Car 2.6%, Van/lorry 1.3%; 2009: Car 3.8%, Van/lorry 1.6%). The second line graph showcases "Hands free" mobile phone use (2002: Car 1.2%, Van/lorry 2.2%; 2003: Car 1.3%, Van/lorry 2.4%; 2004: Car 1.3%, Van/lorry 2.3%; 2005: Car 1.6%, Van/lorry 1.9%; 2006: Car 1.7%, Van/lorry 2.0%; 2007: Car 1.8%, Van,lorry 1.7%; 2008: Car 1.8%, Van/lorry 1.9%; 2009: Car 1.0%, Van/lorry 2.6%). The pie chart from "Road accidents caused by use of mobile phone by drivers - England 2013" depicts fatal accidents 22, serious accidents 73, slight accidents 327.
Given the complexity of the image, the above description may not be entirely accurate.
Skyrocket your IELTS band score by 1-2 points in under a month with our premium plan!
Note: Both the topic and the answer were created by one of our users.
There are 2 total of graphs shows an information about mobile phone use by drivers in England from 2002 to 2009. One is hand held and the other is hands free mobile phone. Meanawhile, the pie chart shows 3 types of road accidents that caused by use of mobile phone in England back in 2013.
The car and van/lorry accidents line graph highest percentage of held hand mobile phone is in 2002 which is up to 1,8% and 2,8% respectively. By contrast, 2007 has the lowest percentages of both car and van/lorry accidents that caused by held hand mobile phone. In the other hand, both car and van/lorry accidents that caused by hands free mobile phone increased rapidly from 2008 to 2009 and the lowest percentages for the hands free mobile phone accidents is in 2007.
The pie chart shows that slight accidents is the most that happened in road that caused by the use of mobile phone which making it 327 accidents in total. Fatal accidents has the lowest number of road accidents.
Overall, car accidents has lower percentages than van/lorry for hand held mobile phone and slight accidents held the most road accidents caused by use of mobile phone in England 2013.
Word Count: 204
