Our system will evaluate the answer based on this AI-generated description.
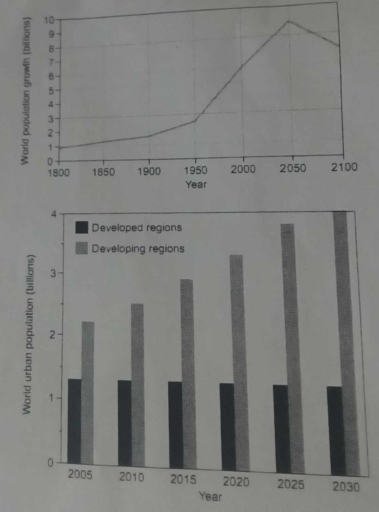
The image contains two graphs. The first graph, a line graph, displays the world population from 1800 to 2100 in billions, with points marked at 1800 (approximately 1 billion), 1900 (approximately 1.6 billion), 1950 (approximately 2.5 billion), 2000 (approximately 6 billion), 2050 (around 9 billion), and 2100 (a decline to about 7 billion). The second graph, a bar graph, shows the world urban population in billions, split into developed and developing regions from 2005 to 2030, with values for developed regions in 2005 (approximately 0.9 billion), 2010 (approximately 1 billion), 2015 (approximately 1.1 billion), 2020 (approximately 1.2 billion), 2025 (approximately 1.3 billion), 2030 (approximately 1.4 billion); and for developing regions in 2005 (approximately 1.8 billion), 2010 (approximately 2.2 billion), 2015 (approximately 2.6 billion), 2020 (approximately 3 billion), 2025 (approximately 3.4 billion), 2030 (approximately 3.8 billion).
Given the complexity of the image, the above description may not be entirely accurate.
Skyrocket your IELTS band score by 1-2 points in under a month with our premium plan!
Note: Both the topic and the answer were created by one of our users.
The line graph illustrates data on global population and bar graph provided information for urban populations in different world areas.
Overall, it clear that value of world population growth’ fluctuated, while population in developed regions remains same and in developing countries shows upward trend.
To start with, in the beginning of the period world population was 1000 million of people, after that its start increases and reached its 2000 million of people in 1940. However, by 1960 it figure was significantly rose up and it will touch its peak value in 2040, the world population will be 8000 million in 2040. But in next 60 years of period their population will decrease, they will be 6000 million in 2100.
By contrast, the number of people in developed and in developing countries were represented different data. By 2015, population of developed regions start from 12000 million, it value level out for the whole period of time. Although, population of developing areas start from 21000 million and it went to upward and in 2040 it will reached out its peaks numbers. There are 4000 million people will be in 2040.
Word Count: 188
