Our system will evaluate the answer based on this AI-generated description.
The image displays data on cinema attendance in Australia from 1996 to 2000: Attendance averaged as percentages of the population are 62% in 1996, 72% in 1997, 72% in 1998, 70% in 1999, and 72% in 2000; Frequency averaged as visits are 10.3 in 1996, 11.1 in 1997, 8.2 in 1998, 8.2 in 1999, and 8.3 in 2000; Cinema visits segmented by age groups from 1996-2000 where age 14-24 recorded approximately 19 visits in 1996, 23 visits in 1997, 15 visits in 1998, 18 visits in 1999, 13 visits in 2000; age 25-34 logged about 14 visits in 1996, 15 visits in 1997, 10 visits in 1998, 13 visits in 1999, 11 visits in 2000; age 35-49 noted close to 11 visits in 1996, 16 visits in 1997, 9 visits in 1998, 12 visits in 1999, 13 visits in 2000; age 50+ reported roughly 13 visits in 1996, 12 visits in 1997, 5 visits in 1998, 11 visits in 1999, 12 visits in 2000.
Given the complexity of the image, the above description may not be entirely accurate.
Skyrocket your IELTS band score by 1-2 points in under a month with our premium plan!
Note: Both the topic and the answer were created by one of our users.
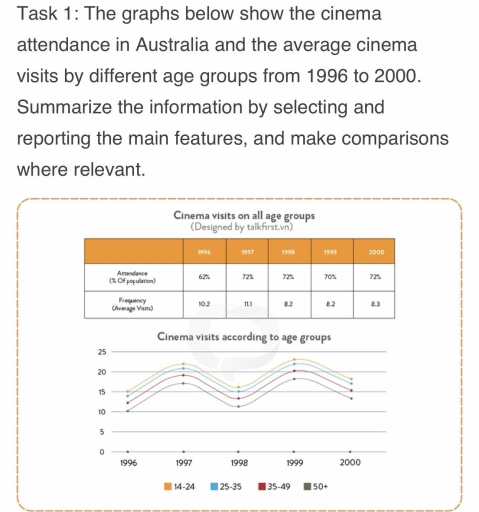
The graphs above give information about percent of person who attend to cinema and frequency of visitors for four age groups from 1996 to 2000.
The most attendance showed in three years in 1997,1998, and 2000, according72 percent. In contrast in 1996, the cinema hosted the least guests- 62 percent. In 1999, attendance was more than 1966 and less than other three years. It was 70 percent.
Overall, from 14 to 24 years old- adults visited cinema more than other ages groups. Only maximum ten percent of over fifty aged people went cinema during a given period.
According to age groups, fluctuations were seen. The number of visitors showed the minimum interest to cinema in 1998. 15 percent adults visited cimena in 1996, the number increased to 23 percent in 1997, then dropped to 17. After 1 year the number rose to 23 percent, the again decreased to 19 percent. Also, i all age groups showed the same amount of fluctuations, neverthless they began different percents; according to 25-35, 35-49 and 50+ aged persons were 14, 13, and 10 percent, respectively.
Word Count: 181