Our system will evaluate the answer based on this AI-generated description.
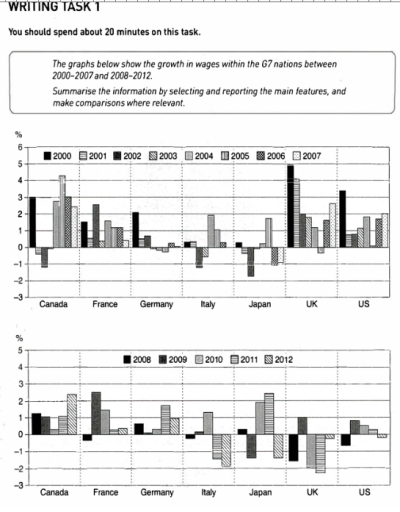
The image shows wage growth percentage data for six countries across two time periods, 2000-2007 and 2008-2012. In Canada from 2000-2007, growth rates are 0.5%, 1%, 0.3%, 1%, -1%, 0.7%, 1.5% respectively, while 2008-2012 rates are -0.8%, 0.9%, 0.6%, 1%, 1.5%. In France for 2000-2007, rates are -1.5%, 1%, 0.3%, 1%, -1.3%, -1%, -0.2%, and for 2008-2012, 0%, -1%, 0.5%, 0.2%, 0.2%. In Germany for 2000-2007, rates are -1.5%, -0.5%, 0%, -1.5%, -0.8%, 1%, -0.3%; for 2008-2012, -1%, 1.5%, -0.8%, 0.5%, 0%. Italy from 2000-2007 shows rates -1%, -2%, -1.3%, -0.5%, -0.6%, -0.5%, -2%, and for 2008-2012, -3%, -3.5%, -3%, 0.5%, -2%. Japan's 2000-2007 rates are -2%, -2%, 0%, -0.5%, 0%, 2%, 3.5%, and 2008-2012 are -3%, -0.5%, -1%, 0.5%, 1.5%. UK shows rates of 2.5%, -1.5%, -3%, 0%, -1%, 2%, 5.5% from 2000-2007, and 4%, -2.5%, 1%, 1.5%, -0.8% for 2008-2012. US data for 2000-2007 is 2%, 2%, 1%, -3%, 1%, 4%, 3.5%, and for 2008-2012, -2%, 0.8%, 0%, 0%, 0.5%.
Given the complexity of the image, the above description may not be entirely accurate.
Skyrocket your IELTS band score by 1-2 points in under a month with our premium plan!
Note: Both the topic and the answer were created by one of our users.
The bar charts compare the increase in incomes within the G7 countries from 2000 to 2007 and from 2008 to 2012. In general, the UK growth dominated the rests at the beginning at the period, while Canada showed an impressive performance at the end of the period.
Looking at the details, the UK outperformed other G7 nations with its 5% increase in 2000, which was the highest point among the countries during the period. Followed that, the US and Canada had good performance growth at around 3.5% and 3%, respectively. However, during their last 5-year periods, the UK and US experienced downward trends, even the UK plunged into its lowest point at more than -2% in 2011.
On the other hand, some countries had promising rises during their last 5-year periods. Canada consistently have positive wage growth even though experienced several fluctuations (ranged around -0,5% to 2,5% annually). While France and Germany also encountered similar trends, Japan showed significant changes annually, from approximately -1,5% in 2009 to its peak at 2,5% in the subsequent years.
Word Count: 175
