Our system will evaluate the answer based on this AI-generated description.
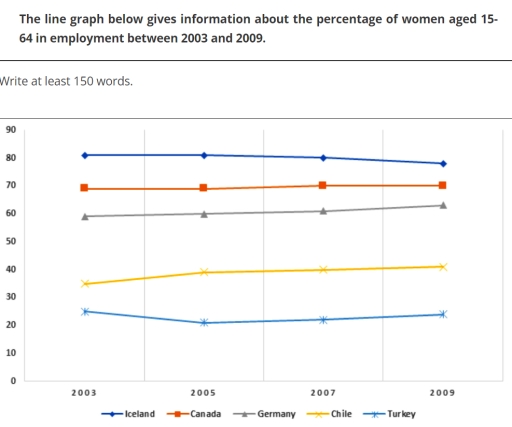
The image shows a line graph displaying the percentage of women aged 15-64 in employment between 2003 and 2009 in five different countries (Iceland, Canada, Germany, Chile, and Turkey). Data points for each country are represented by distinct shapes for each year. In 2003, Iceland had about 80%, Canada had about 70%, Germany had around 60%, Chile had approximately 35%, and Turkey started with about 25%. By 2005, Iceland's percentage increased slightly to just above 80%, Canada remained close to 70%, Germany showed a small increase to just above 60%, Chile's percentage dropped to just below 35%, and Turkey decreased to around 23%. In 2007, Iceland's percentage remained above 80%, Canada's stayed near 70%, Germany's increased to about 65%, Chile rose slightly to just above 35%, and Turkey decreased further to just above 20%. In the final year, 2009, Iceland's percentage remained steady above 80%, Canada's stayed near 70%, Germany's increased slightly to around 67%, Chile decreased to just below 35%, and Turkey decreased further to just below 20%. The graph illustrates trends over the six-year period for each country in terms of the percentage of women employed within the specified age range.
Given the complexity of the image, the above description may not be entirely accurate.
Skyrocket your IELTS band score by 1-2 points in under a month with our premium plan!
Note: Both the topic and the answer were created by one of our users.
The line graph provides the information about percentage of females employed in age range from 15 to 64 in 5 picked countries over 4 particular years. Stats are given about Chile, Canada, Germany, Iceland and Turkey in 2003,2005,2007 and 2009.
Overall, percentage of women in employment in Germany, Iceland and Canada is roughly double than in other countries given. Only in Germany and Chile, the rate of females employed was increased over the period given, as opposed to Canada, Iceland, and Turkey, where it has experienced fluctuation but overall decreased a bit.
In 2005, Iceland had about 80%, Canada had approximately 70%, Germany had a bit less than 60%, whereas Chile and Turkey had only around 35% and 25%. By 2005, In Iceland it was slightly increased to above 80%, Canada had not experienced significant changes, remaining at 70%, Germany had just a bit more than 60%, Chile had experienced a grow for 5% and turned into 40%;however, Turkey was diminished from 25% to 20%. In 2007, Canada,Iceland and Germany retain almost the same percentage as in previous year(80%,70% and 60%). In contrast, Turkey and Chile was increased by a few percent. In final year, Iceland slightly decreased to 75% approximately, Canada as well as Germany rose by almost 5%. Chile reached 40%, and Turkey 25%.
Word Count: 216
