Our system will evaluate the answer based on this AI-generated description.
The image shows Vietnam starting at 12% in 1995, dipping to below 4% in 2000, below 10% in 2005, then peaking above 20% in 2010, finishing at above 5% in 2015; Nigeria starts just above 20% in 1995, fluctuates above 20%, dips to below 7% in 2000, rises to above 15% in 2005, levels near 12% in 2010, drops to just above 8% in 2015; Costa Rica starts near 18% in 1995, above 10% in 2000, climbs to just under 15% in 2005, dips to about 5% in 2010, then rises to about 10% in 2015; Greece begins close to 9% in 1995, decreasing to about 3% in 2000, slight rise to 4% in 2005, near 5% in 2010, ends slightly above zero in 2015; India starts at 10% in 1995, below 4% in 2000, close to 4% in 2005, around 12% in 2010, then decreases to below 7% in 2015; Poland starts at 7% in 1995, above 10% in 2000, dropping to 3.5% in 2005, around 2.5% in 2010, slightly negative near 2015.
Given the complexity of the image, the above description may not be entirely accurate.
Skyrocket your IELTS band score by 1-2 points in under a month with our premium plan!
Note: Both the topic and the answer were created by one of our users.
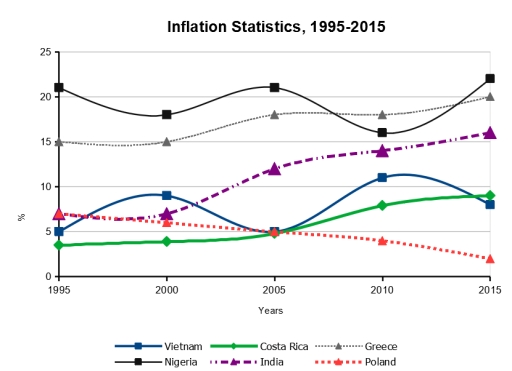
The line graph compares the inflation figures across six countries throughout the period from 1995 to 2015.
Overall, there was a rise in all countries, with the exception of Poland. While Nigeria and Greece demonstrated the top figures, Poland reported the lowest inflation statistics. In terms of changes, India faced the most significant growth.
Starting with the leading figures, the inflation percentage of Nigeria was the highest and had increased slightly from 22% in 1995 to 23% by 2015, despite a fluctuating trend. Greece showed a gradual growth, rising from 15% to 20% during these 20 years. As for India, the inflation rate more than doubled from 7% initially to 16% eventually.
Turning to the rest of the countries, the Vietnamase indicator experienced a sharp volatility between 5% and 12%, but it finished the period at 8%, three times lower than in Nigeria. Poland was the only nation that decreased its inflation from 7% in 1995 to 2% in the end, overall lowest on this graph. Finally, the inflation rate of Costa Rica demonstrated stability in the first ten years (about 4%), but later increased two times to 9%.
Word Count: 189