🔥 Today Only: Save 30% on Premium — Offer Ends Soon! - Upgrade Now!
Line Graph

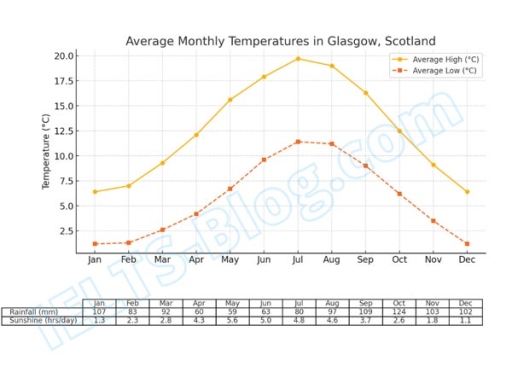
Band 5+: The line graph below shows the average high and low temperatures in Glasgow, Scotland, over the course of a year, while the table provides information on the average monthly rainfall and sunshine hours. Summarise the information by selecting and reporting the main features, and make comparisons where relevant.

Image for topic: The line graph below shows the average high and low temperatures in Glasgow, Scotland, over the course of a year, while the table provides information on the average monthly rainfall and sunshine hours. Summarise the information by selecting and reporting the main features, and make comparisons where relevant.
Our system will evaluate the answer based on this AI-generated description.
The image displays average monthly temperatures in Glasgow, Scotland, indicating average high (°C) and average low (°C) with precise monthly values: Jan, high 7.0 low 1.0; Feb, high 7.5 low 1.5; Mar, high 9.5 low 2.5; Apr, high 12.0 low 4.0; May, high 15.5 low 7.0; Jun, high 18.0 low 10.0; Jul, high 19.0 low 12.0; Aug, high 18.5 low 11.5; Sep, high 15.5 low 9.5; Oct, high 12.5 low 6.5; Nov, high 9.0 low 3.0; Dec, high 7.5 low 2.0. Table below provides additional numerical metrics: rainfall in mm and sunshine in days, specifically: Jan, rainfall 136 sunshine 13; Feb, rainfall 107 sunshine 23; Mar, rainfall 128 sunshine 46; Apr, rainfall 73 sunshine 98; May, rainfall 58 sunshine 138; Jun, rainfall 71 sunshine 153; Jul, rainfall 69 sunshine 148; Aug, rainfall 88 sunshine 136; Sep, rainfall 96 sunshine 117; Oct, rainfall 112 sunshine 91; Nov, rainfall 131 sunshine 37; Dec, rainfall 139 sunshine 12.
Given the complexity of the image, the above description may not be entirely accurate.
Note: Both the topic and the answer were created by one of our users.

The given mixed charts demonstates average temperature in glasgow meanwhile the table chart illustatres the average rainfall and sunshine, accounting on cm and hours per day, respectively.

Overall, the temperature in this area is experienced a dramatical increase in the fist half year, and then it decline reamarkably in last 6 months. In addition, the average rainfall and sunshine are witnessed ups and downs during a year.

The temperature in the first quater of year is ranging from about 2 to more or less 6. Then the gap between maximum and minimum of the temperature is apporximately 8 in april to july. In april, the minimum is about 3 and the maximum is around 9 before it raise gardually to reach the peak at both minium and maximum temperature in august , accounting on 10 and around 19 respectively. In the last months, the temperature siginificantly decline at 2 for the minium and 8 for maximum in december.

The average rainfall in the first 2 years and last half years range form 9,5 to 12,5 with the minium is august and maximum is december while the average rainfall of other months is doubt lower than that at about 6. the sunshine is experienced a dramatic gap which is about 1 to 15 during a year.

Word Count: 215

Answers On The Same Topic:

The line graph below shows the average high and low temperatures in Glasgow, Scotland, over the course of a year, while the table provides information on the average monthly rainfall and sunshine hours. Summarise the information by selecting and reporting the main features, and make comparisons where relevant.

The line graph and table provide information about average temperatures, rainfall and sunshine in Glasgow, Scotland, on a monthly basis. Overall, both temperature levels and the amount of sunshine increased towards the summer months before declining during the remainder of the year. Rainfall, by contrast, generally fell during the first half of the year before […]

The line graph below shows the average high and low temperatures in Glasgow, Scotland, over the course of a year, while the table provides information on the average monthly rainfall and sunshine hours. Summarise the information by selecting and reporting the main features, and make comparisons where relevant.

The chart compares the average high and low temperatures in Glasgow, Scotland, over a year, whereas the table illustrates the average rainfall and sunshine hours each month. Overall, the figures for high and low temperatures follow similar trends, both peaking in July. There is generally an inverse relationship between rainfall and sunshine hours, with sunny […]

The line graph below shows the average high and low temperatures in Glasgow, Scotland, over the course of a year, while the table provides information on the average monthly rainfall and sunshine hours. Summarise the information by selecting and reporting the main features, and make comparisons where relevant.

The climate diagram illustrates the mean temperature in a city in Scotland. The table compares the average rainfall and sunshine throughout the period shown. Overall, it is immediately apparent that the mean temperature from June to August was generally higher than that in the remaining nine months. Additionally, the amount of rainfall from August to […]

The line graph below shows the average high and low temperatures in Glasgow, Scotland, over the course of a year, while the table provides information on the average monthly rainfall and sunshine hours. Summarise the information by selecting and reporting the main features, and make comparisons where relevant.

The line graph and table illustrate average monthly temperature, precipitation and sunshine in Glasgow, Scotland. Overall, avergae highest and lowest temperatures can be seen in Summer, especially in July, however highest precipitation rates can be spotted in Autumn, October. In addition, sunshine raised the most in May. As for the temperature rates, the highest average […]

The line graph below shows the average high and low temperatures in Glasgow, Scotland, over the course of a year, while the table provides information on the average monthly rainfall and sunshine hours. Summarise the information by selecting and reporting the main features, and make comparisons where relevant.

The given charts provide data on the weather for Glasgow – a city in Scotland. Overall, in Glasgow, the temperature and sunshine hours share the same patterns due to the increase over the first 6 months and then fall after that. While there is hotter between June and August, December and January appear to be […]

See All

Other Topics:

The Graph shows information about the number of marriages in the UK from 1951 to 2001

The line graph illustrates the account of marraiages status in the united kingdom from 1951 to 2001.measured by thousands,there has three catagories: All marriages, Remarriages and First marriages. Overall,it can be seen that in 1981 was the maximum number of marriages and Remarriage. whereas in 2001 was the lowest number of marriage and Remarriage. Approximately, […]

The line graph shows the percentage of people in the UK with access to different types of recreational activities from 1996 to 2006.

The graph illustrates percentage of access to different types of recreational activities within the people in the UK. Overall, all types of activities experienced growth over the given period. Although, going to gym showed the most significant leap. Regarding 3 out of 4 recreational ativities: watching TV, listening to music and reading books experienced similar […]

The line graph shows the percentage of people in the UK with access to different types of recreational activities from 1996 to 2006.

The graph illustrates percentage of access to different types of recreational activities within the people in the UK. Overall, all types of activities experienced growth over the given period. Although, going to gym showed the most significant leap. Regarding 3 out of 4 recreational ativities: watching TV, listening to music and reading books experienced similar […]

The line graph shows distance covered in a 100-kilometer race between a tortoise and a hare.

the line graph presents distance travelled in a 100-kilometer race between a tortoise and a hare. overall, the garph shows that at the beginning both the hare and the torotoise were going at an equal distance. but, after a while the hare overtook the tortoise and sped up after that, the hare took a nap […]

The chart below shows the percentage of people who used the Internet in three different countries between 2000 and 2020

The chart shows the percentage of people who used the Internet in three different countries between 2000 and 2020. Overall, the number of Internet users increased in all three countries. The biggest increase was in Country A, while Country C had the lowest percentage during most of the period. In 2000, about 20% of people […]

The line graph below shows trends in science, reading and mathematics performance between 2006 and 2025, measured in PISA score points according to the OECD average. Summarise the information by selecting and reporting the main features, and make comparisons where relevant.

The line chart illustrates science, reading, and mathematics performance from 2006 to 2025, measured in PISA score points according to the OECD average. Overall, the given chart highlights significant variations in the three trends over the period, where, science recorded the highest score in 2009, while mathematics and reading recorded the lowest score in 2025, […]

See All
We have detected unusual activity on your device.
Please verify your identity to continue.
Note: This verification step won't sign you in. If you have a premium account, please log in to access the service as usual.
Google/Gmail Verification
Or verify using Email/Code
We've sent a verification code to:
youremail@gmail.com (Not your email?)
Enter it below to complete the verification process.
Ensure your email address is correct, your inbox is not full, and you check your spam folder. If no email arrives, consider using an alternative email.
You will need a Premium plan to perform your action!
Note: If you already have a premium account, please log in to access our services as usual.

Plans & Pricing

Our mission is to make quality education accessible for everyone.
However, to keep our hardworking team running and this service alive, we genuinely need your support!
By opting for a premium plan, not only do you sustain us in achieving the mission, but you also unlock advanced features to enrich your learning experience.

Free

For learners who aren't pressed for time

What's included on Free
100+ Cambridge IELTS Tests
Instant IELTS Writing Task 1 & 2 Evaluation (2 times/month)
Instant IELTS Speaking Part 1, 2, & 3 Evaluation (2 times/month)
Instant IELTS Writing Task 1 & 2 Essay Generator (2 times/month)
500+ Dictation & Shadowing Exercises
100+ Pronunciation Exercises
Flashcards
Other Advanced Tools

Premium

For those serious about advancing their English proficiency, and for IELTS candidates aspiring to boost their band score by 1-2 points (especially in writing & speaking) in just 30 days or less

What's included on Premium
Save Your IELTS Test Progress & Analyze Mistakes By Question Type
Save Your Own Flashcard Sets & Use Them On Any Device
Unlock All Courses, IELTS Tests, Section & Part Practice
Unlimited AI Conversations
Unlimited AI Writing Enhancement Exercises
Unlimited IELTS Writing Task 1 & 2 Evaluation
Unlimited IELTS Speaking Part 1, 2, & 3 Evaluation
Checked Answers Will Not Be Published
Unlimited IELTS Writing Task 1 & 2 Essay Generator
Unlimited IELTS Speaking Part 1, 2, & 3 Sample Generator
Unlimited Usage Of Advanced Tools & AI Features
Priority Support within 24h (12-month plan only)

Due to the nature of our service and the provided free trials, payments are non-refundable.