Our system will evaluate the answer based on this AI-generated description.
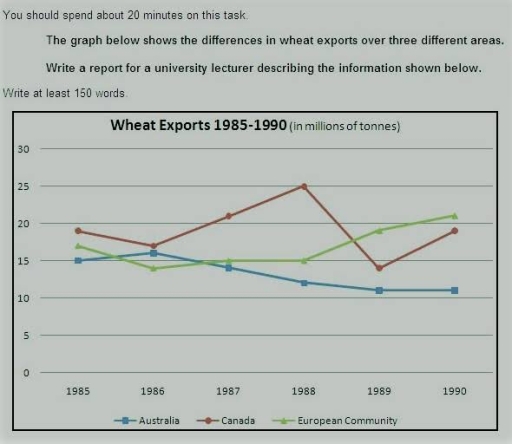
The image shows a line graph displaying wheat exports from 1985 to 1990 in millions of tonnes for Australia, Canada, and the European Community. In 1985, Australia exported around 15 million tonnes, Canada exported just over 20 million tonnes, and the European Community exported slightly below 15 million tonnes. In 1986, Australia's exports fell to about 11 million tonnes, Canada's exports increased to approximately 25 million tonnes, and the European Community's exports decreased to under 14 million tonnes. In 1987, all three saw a decline, with Australia at about 9 million tonnes, Canada at about 19 million tonnes, and the European Community at around 13 million tonnes. In 1988, Australia's exports rose to about 15 million tonnes, Canada's exports also increased to around 21 million tonnes, and the European Community's exports jumped to about 20 million tonnes. In 1989, Australia's exports declined to around 11 million tonnes, Canada's exports drastically decreased to about 15 million tonnes, and the European Community's exports rose sharply to about 24 million tonnes. In 1990, Australia's exports remained around 11 million tonnes, Canada's exports increased to approximately 19 million tonnes, and the European Community's exports decreased slightly to around 21 million tonnes.
Given the complexity of the image, the above description may not be entirely accurate.
Skyrocket your IELTS band score by 1-2 points in under a month with our premium plan!
Note: Both the topic and the answer were created by one of our users.
The line chart below indicates the amount of wheat that has been exported in different areas such as Canada, Australia, and the European community. Overall, as the graph shows, only European community had upward trend over the period, while Australia steadily decreased. In terms of Canada, its percentages substantially fluctuated
In 1985 Australia had slight increase however, then it slowly fell until 1990, reaching just over 10 million tonnes. Meanwhile, the European community starting at nearly 17 million tonnes it moderately declined to 14 million tonnes in 1986. However, after that it gradually climbed to approximately 21 million tonnes by 1990 becoming the largest export centre of wheat.
Regarding Canada’s rates, it had the biggest amount of wheat comparing with others. At the start of the period, It showed just under 20 million tonnes, then it slightly dipped to almost 17 million tonnes,. Then in 1986 it soared and peaked at 25 million. Until 1990 it had some rapid changes and by the end of the period stood at around 19 million tonnes.
Word Count: 173
