Our system will evaluate the answer based on this AI-generated description.
The image shows a line graph displaying wheat exports from 1985 to 1990 in millions of tonnes for Australia, Canada, and the European Community. In 1985, Australia exported around 15 million tonnes, Canada exported just over 20 million tonnes, and the European Community exported slightly below 15 million tonnes. In 1986, Australia's exports fell to about 11 million tonnes, Canada's exports increased to approximately 25 million tonnes, and the European Community's exports decreased to under 14 million tonnes. In 1987, all three saw a decline, with Australia at about 9 million tonnes, Canada at about 19 million tonnes, and the European Community at around 13 million tonnes. In 1988, Australia's exports rose to about 15 million tonnes, Canada's exports also increased to around 21 million tonnes, and the European Community's exports jumped to about 20 million tonnes. In 1989, Australia's exports declined to around 11 million tonnes, Canada's exports drastically decreased to about 15 million tonnes, and the European Community's exports rose sharply to about 24 million tonnes. In 1990, Australia's exports remained around 11 million tonnes, Canada's exports increased to approximately 19 million tonnes, and the European Community's exports decreased slightly to around 21 million tonnes.
Given the complexity of the image, the above description may not be entirely accurate.
Skyrocket your IELTS band score by 1-2 points in under a month with our premium plan!
Note: Both the topic and the answer were created by one of our users.
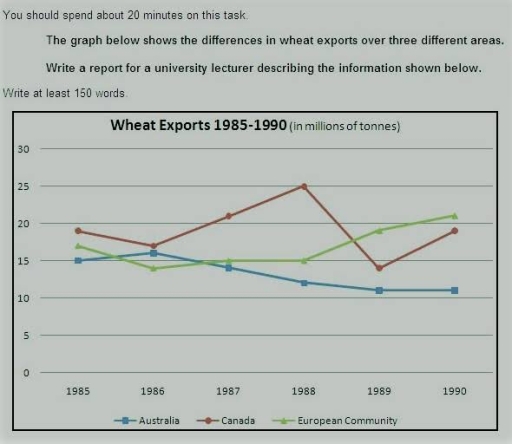
The diagram delineate the differences in wheat exports among three different regions such as Australia, Canada and European Community during 5-year time frame starting from 1985.
Overall,the three regions experienced vastly different trends.While European Community had the best results,Australia’s exports slightly decreased over period.Meanwhile,the wheat exports of Canada faced significant flactuations but remained the high overall.
The wheat exports of both Canada and European Community faced gradual decrease between 1985 and 1986.Afterthat, the wheat exports of Canada rose significantly from roughly 17 millions tonnes to 25 milion during 1986 and 1988.Then, it sharply go down to approximately 14 million tonnes but later it stabilazed to about 19 million tonnes from 1988 to 1990.Meanwhile,after downfall,the exports of European community slightly escalated from around 14 million tonnes to 15 million and stay the same over 1987 and 1988.Afterthat, there was dramatical growth to 21 million tonnes and it hit the high of exports in 1990.
On the other hand, Australia followed a completely different path. It began the period as the smallest exporter at 15 million tonnes. Despite a brief increase to around 16 million tonnes in 1986, Australian wheat exports fell continuously over the remaining four years. By 1990, the volume had dropped to approximately 11 million tonnes, making Australia the lowest exporter of the three regions.
Word Count: 216
