Our system will evaluate the answer based on this AI-generated description.
The image displays "Monthly Revenue of Jewelry & Co." with the y-axis showing "thousands of euros" from 0 to 90 in increments of 10, and the x-axis depicting months from January to December. Four shops are represented: Shop 1 (triangle symbol), Shop 2 (circle symbol), Shop 3 (square symbol), and Shop 4 (diamond symbol). Shop 1 starts at 40, steadily increases, dips below 60 in April, peaks at 80 in May, decreases to below 60 in July, exceeds 70 in August, drops to 60 in September, and surpasses 80 in December. Shop 2 commences at 20, experiences a slight drop in February, rises to over 60 in June, reduces to 50 in August, climbs to 75 in November, and marginally declines in December. Shop 3 starts at 15, steadily ascends to over 70 in October, slightly diminishes in November, and reaches approximately 80 in December. Shop 4 begins at over 10, gradually increases to above 70 in May, drops to around 70 in June, July, and August, ascends to peak at 90 in October and November, and drops to 85 in December.
Given the complexity of the image, the above description may not be entirely accurate.
Skyrocket your IELTS band score by 1-2 points in under a month with our premium plan!
Note: Both the topic and the answer were created by one of our users.
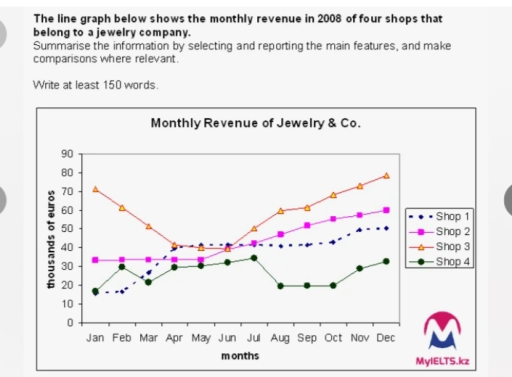
The line graph gives the information about the income of 4 jewelry shops throughout 12 months in 2008. Units are measured in euros.
Overall, shop 3 stayed in the leader position over the whole period in spite of showing a downward tendency from April to July. And the lowest position had been taken by shop 1 at the beginning of the term and it were outraced by shop 4 at the end of the year.
It terms of shops with higher profits, Shop 3 started at 70,000 euros and it collapsed noticeably to about 45,000 euros in April, where it faced the index of shop 1. Also shop 3 had remained at the same level for 4 months before it rocketed up markedly to almost 80,000 euros. Furthermore Shop 2 began at just over 30,000 euros and it had a constant grow until December, when it reached at approximately 60,000 euros. However, in July it came across the revenue figures of Shop 1 and Shop 3.
With regards to the lower lines in the graph, Shop 1 and Shop 4 had almost the same number of incomes with roughly 16ooo euros and they had been intercrossed together in 2 months before the both experienced an upward tendency with some fluctuations.
Word Count: 210
