Our system will evaluate the answer based on this AI-generated description.
The image shows a graph plotting percentage against time from 1980 to 2010 at 5-year intervals for four categories: Art Gallery, Pavilion, Pier, and Festival. Art Gallery starts at 20% in 1980, increases to 32.5% in 1985, 22.5% in 1990, drops to 20% in 1995, rises to 27.5% in 2000, declines to 22.5% in 2005, and finishes at 25% in 2010. Pavilion begins at 15% in 1980, rises to 27.5% in 1985, drops to 22.5% in 1990, increases to 30% in 1995, falls to 22.5% in 2000, remains steady through 2005, and ends at 17.5% in 2010. Pier starts at 25% in 1980, falls to 15% in 1985, rises sharply to 47.5% in 1990, drops to 42.5% in 1995, plummets to 12.5% in 2000, rises slightly to 17.5% in 2005, and finishes at 20% in 2010. Festival commences at 40% in 1980, decreases to 25% in 1985, jumps to 37.5% in 1990, declines steeply to 5% in 1995, increases to 10% in 2000, remains stable in 2005, and ends at 37.5% in 2010.
Given the complexity of the image, the above description may not be entirely accurate.
Skyrocket your IELTS band score by 1-2 points in under a month with our premium plan!
Note: Both the topic and the answer were created by one of our users.
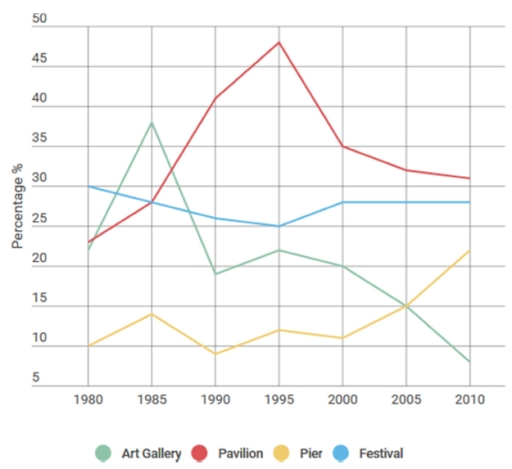
The line chart displays the percentage of tourists that went to England and explored four attractions in the city of Brighton between 1980 to 2010.
Overall, despite the fluctuations pavilion and pier increased over the 30 years period. Also, Art gallery and festival had oscillation over time but ended up decreasing from 1980 to 2010.
The percentage of tourist that visited the Pavilion attraction was raising from ~23% to ~47% between 1980 to 1995, then it end up decreasing to ~32% up to 2010. Additionally, Pier oscillated near t 10% from 1980 to 2000, and then it constantly grew up to ~22% in 2010.
The Art gallery had a major increase from 1980 to 1985, increasing from ~23% to ~38% in only 5 years. Then over the time, the percentage of tourism declined up to 2010, decreasing almost all the years (Excepting the period from 1990 to 1995) and reaching near to 8% of the tourists. Finally, the percentage of tourists that went to the festival dropped from 30% to 25% since 1980 to 1995, then it grew 5 years to 28% and then it remained constant over the years up to 2010.
Word Count: 193
