Our system will evaluate the answer based on this AI-generated description.
The image presents a line graph showing finances for a New Zealand local authority from 2012 to 2022, with four categories: Rates Revenue, User Charges, Borrowings, and Grants and Subsidies. In 2012, Rates Revenue is approximately $1,200 million, User Charges around $600 million, Borrowings about $300 million, and Grants and Subsidies near $450 million. By 2015, Rates Revenue reaches $1,500 million, User Charges $800 million, Borrowings $350 million, and Grants and Subsidies $400 million. In 2020, Rates Revenue hits $2,000 million, User Charges $1,000 million, Borrowings $650 million, and Grants and Subsidies $350 million. By 2022, Rates Revenue peaks at about $2,500 million, User Charges about $1,200 million, Borrowings approximately $750 million, and Grants and Subsidies around $450 million. The data points demonstrate numerical values for each financial year ending on June 30th within these given years.
Given the complexity of the image, the above description may not be entirely accurate.
Skyrocket your IELTS band score by 1-2 points in under a month with our premium plan!
Note: Both the topic and the answer were created by one of our users.
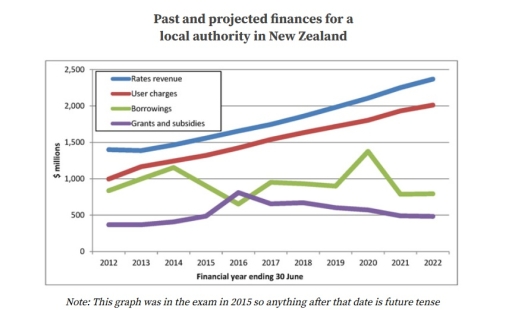
The graph illustrates the financial conditions of New Zealand’s local government that distributes million dollars on several needs in the past and for future prediction for eleven years.
It is clear that the rates revenue and user charges of local authority finances in New Zealand gradually increased while the borrowings and grants and subsidies were slightly unstable from 2012 until 2022.
The rates revenue and user charges have the same condition that is stable. In 2012, the local government of New Zealand allocated 1.400 million dollars to the rates revenue that was the highest finance of the four categories. It was followed by the user charges at 1.000 million dollars. The rates revenue and user charges kept increasing from 2013 until 2015 and are also predicted increasing until 2022.
On the other hand, the borrowings and grants and subsidies show considerable fluctuation. In 2012, the grants and subsidies just reached under 400 million dollars which were the lowest finance. It is different from the borrowings that can exceed the grants and subsidies over 700 million dollars. However, the condition of both is not constant from 2013 until 2022.
Word Count: 188
