🔥 Today Only: Save 30% on Premium — Offer Ends Soon! - Upgrade Now!
Line Graph

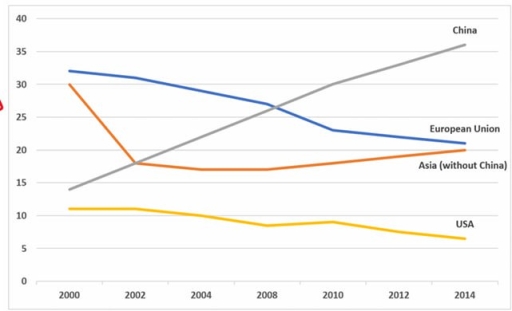
Band 6+: The line graph shows the proportion of total exports of clothing in 4 parts of the world between 2000 and 2014.

Image for topic: The line graph shows the proportion of total exports of clothing in 4 parts of the world between 2000 and 2014.
Our system will evaluate the answer based on this AI-generated description.
The image presents a line graph from 2000 to 2014 detailing numerical data for four entities: China, European Union, Asia (without China), and USA. In 2000, China starts at 8, European Union at 28, Asia (without China) at 26, and USA at 12. By 2002, China reaches 10, European Union at 26, Asia (without China) at 22, and USA at 11. In 2004, China's data moves to 15, European Union sits at 24, Asia (without China) at 19, and USA at 10. By 2006, China edges up to 19, European Union remains at 23, Asia (without China) remains steady at 19, and USA slightly lowers to 9. The 2008 data shows China at 23, European Union continuing at 23, Asia (without China) consistent at 19, USA at 9. In 2010, China advances to 27, European Union decreases to 21, Asia (without China) is steady at 19, and USA slightly dips to 8. By 2012, China records 32, European Union decreases to 20, Asia (without China) at 20, and USA charts 7. In 2014, China tops at 36, European Union stabilizes at 20, Asia (without China) at 21, and USA declines further to 6.
Given the complexity of the image, the above description may not be entirely accurate.
Note: Both the topic and the answer were created by one of our users.

The line graph illustrates the percentage of clothing exported in four countries including USA, Asia, European Union and China in the 14-year- period from 2000 to 2014.

Overall, the USA was the country with the lowest export rate of clothing. Another remarkable feature is that China witnessed the most significant growth while three others saw the reverse or a stability.

In 2000, the export volumes of clothing in the European Union was the highest, accounting for about 32%. Then, this percentage fell sharply by nearly 10%, at approximately 21% in 2014. In contrast, the amount of clothing export in China skyrocketed from just above 15% in 2000 to over 25% in 2008. From this year on, China surpassed the European Union and became the biggest clothing exporter, with the percentage at its peak of around 36% in the last year.

On the other hand, after a dramatic decrease from 30% in 2000 to under 20% in the next 2 years, Asia experienced a slight upward trend in the clothing export rate till the end of the period, at 20%. Over 14 years, the USA always remained as the least significant exporter of 4 countries, with its amount ranging from 6% to more than 10%.

Word Count: 204

Answers On The Same Topic:

The line graph shows the proportion of total exports of clothing in 4 parts of the world between 2000 and 2014.

The line graph illustrates the proportion of water in UK rivers that divided four countries as having good chemical quality water namely Wales, Northern Ireland, England and Scotland changed between 1990 and 2002. Overall, the high percentage of positive chemical quality water were Wales and Northern Ireland. However, the opposite was true with England and […]

The line graph shows the proportion of total exports of clothing in 4 parts of the world between 2000 and 2014.

The line graph below illustrates the consumption of three types of spreads between 1982 and 2007 Overall, there was a downward trend in margarine and butter, while low fat and reduced spreads experienced an upward trend over the period. Low fat and reduced spread-s was not as popular as margarine and butter until 1996. The […]

The line graph shows the proportion of total exports of clothing in 4 parts of the world between 2000 and 2014.

The line graph illustrates proportion of total exports of clothing in 4 different countries or contenents from 2000 to 2014. The proportion of total exports of clothing in China showed steady but significant rise over the period, while the rate of total exports of clothing in USA experienced a downward trend. The proportion of total […]

The line graph shows the proportion of total exports of clothing in 4 parts of the world between 2000 and 2014.

The line chart depicts how many travellers visited a Caribbean island from 2010 to 2017, staying on cruise ships, on the island and the number of them totally. The data is measured in millions. At first glance, it is readily obvious that Caribbean island witnessed a gradual growth in the number of visitors, despite minor […]

The line graph shows the proportion of total exports of clothing in 4 parts of the world between 2000 and 2014.

The given chart illustrates amount of paper,wood pulp and sawn-wood manufactured in the UK from 1980 to 2000, spanning a 20-year period Overall,the amount of paper and packaging witnessed an upward trend, while reverse pattern could be seen on sawn-wood.On the other hand ,the total amount of wood-pulp production witnessed an flactuation,which decreased and then […]

See All

Other Topics:

The chart gives information on average monthly temperatures in Paris, Boston, and Melbourne.

Overall, Paris and Boston had an upward trend in the first half of the period, and a decline in the second part, whereas Melbourne followed an opposite trend. At the beginning of the period, Melbourne was the leader at 25, while Paris and Boston were at around 8 and 4 respectively. By April, Boston at […]

.The line chart shows average attendance at the cinema among various age groups in the US from 2000 to 2011.

The line graph compares the percentage of four age brackets who visited the cinema in the USA between 2000 and 2011. What is most striking when looking at the data is the significant growth in cinema attendance across all age groups over the given period. Notably, the 15-24 age group tended to watch movies more […]

The line graph below shows the number of overseas tourists in millions who visited France, Japan, and Spain between 1990 and 2020.

The diagram illustrate alters in the amount of international tourists, who visited three different countries, such as France, Spain and Japan between 1990 and 2020. Overall, the data indicate a significant increase in the number of France and Spain over the period, whereas Japan experienced a gradual decline, following a completely different trend from the […]

The chart below shows the average monthly cost of contracts for four different mobile (cell) phones in a European country from January to September 2002, measured in euros.

The line graph witnesses an information about the average price of contracts for four types of cell phones per month in a certain European country between January and September in 2002. Overall, we can see that almost all sort of mobile phones showed an upward trend except for alpha, which contract increased gradually, but at […]

The line graph shows the energy consumption in Country X between 2000 and 2018.

The line graph shows the proportion of energy consumed from renewable and non-renewable sources in country X over an 18-year timeframe between 2000 and 2018. Overall, non-renewable energy consistently accounted for the vast majority of total consumption throughout the period, despite experiencing a steady decline. Conversely, the proportion/share of renewable energy demonstrated a sustained growth, […]

The line chart below shows information on fast food consumption in the UK. rite a report describing the information given

The line graph provided gives information about fast food consumption in grammes in the UK over the period from 1970 to 1990. Overall, Fish and Chips and Hamburger experienced an overall increase, whereas pizza showed an opposite trend. Starting with hamburgers, the figure stood at below 50 in 1970. It then increased gradually, reaching above […]

See All
We have detected unusual activity on your device.
Please verify your identity to continue.
Note: This verification step won't sign you in. If you have a premium account, please log in to access the service as usual.
Google/Gmail Verification
Or verify using Email/Code
We've sent a verification code to:
youremail@gmail.com (Not your email?)
Enter it below to complete the verification process.
Ensure your email address is correct, your inbox is not full, and you check your spam folder. If no email arrives, consider using an alternative email.
You will need a Premium plan to perform your action!
Note: If you already have a premium account, please log in to access our services as usual.

Plans & Pricing

Our mission is to make quality education accessible for everyone.
However, to keep our hardworking team running and this service alive, we genuinely need your support!
By opting for a premium plan, not only do you sustain us in achieving the mission, but you also unlock advanced features to enrich your learning experience.

Free

For learners who aren't pressed for time

What's included on Free
100+ Cambridge IELTS Tests
Instant IELTS Writing Task 1 & 2 Evaluation (2 times/month)
Instant IELTS Speaking Part 1, 2, & 3 Evaluation (2 times/month)
Instant IELTS Writing Task 1 & 2 Essay Generator (2 times/month)
500+ Dictation & Shadowing Exercises
100+ Pronunciation Exercises
Flashcards
Other Advanced Tools

Premium

For those serious about advancing their English proficiency, and for IELTS candidates aspiring to boost their band score by 1-2 points (especially in writing & speaking) in just 30 days or less

What's included on Premium
Save Your IELTS Test Progress & Analyze Mistakes By Question Type
Save Your Own Flashcard Sets & Use Them On Any Device
Unlock All Courses, IELTS Tests, Section & Part Practice
Unlimited AI Conversations
Unlimited AI Writing Enhancement Exercises
Unlimited IELTS Writing Task 1 & 2 Evaluation
Unlimited IELTS Speaking Part 1, 2, & 3 Evaluation
Checked Answers Will Not Be Published
Unlimited IELTS Writing Task 1 & 2 Essay Generator
Unlimited IELTS Speaking Part 1, 2, & 3 Sample Generator
Unlimited Usage Of Advanced Tools & AI Features
Priority Support within 24h (12-month plan only)

Due to the nature of our service and the provided free trials, payments are non-refundable.