Our system will evaluate the answer based on this AI-generated description.
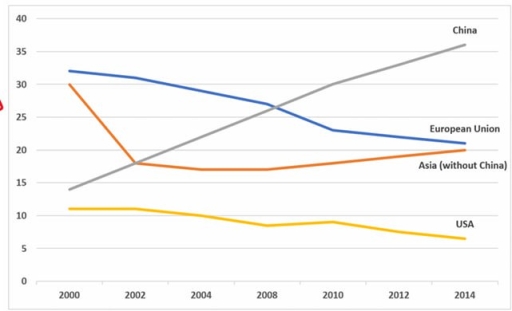
The image presents a line graph from 2000 to 2014 detailing numerical data for four entities: China, European Union, Asia (without China), and USA. In 2000, China starts at 8, European Union at 28, Asia (without China) at 26, and USA at 12. By 2002, China reaches 10, European Union at 26, Asia (without China) at 22, and USA at 11. In 2004, China's data moves to 15, European Union sits at 24, Asia (without China) at 19, and USA at 10. By 2006, China edges up to 19, European Union remains at 23, Asia (without China) remains steady at 19, and USA slightly lowers to 9. The 2008 data shows China at 23, European Union continuing at 23, Asia (without China) consistent at 19, USA at 9. In 2010, China advances to 27, European Union decreases to 21, Asia (without China) is steady at 19, and USA slightly dips to 8. By 2012, China records 32, European Union decreases to 20, Asia (without China) at 20, and USA charts 7. In 2014, China tops at 36, European Union stabilizes at 20, Asia (without China) at 21, and USA declines further to 6.
Given the complexity of the image, the above description may not be entirely accurate.
Skyrocket your IELTS band score by 1-2 points in under a month with our premium plan!
Note: Both the topic and the answer were created by one of our users.
The given chart illustrates amount of paper,wood pulp and sawn-wood manufactured in the UK from 1980 to 2000, spanning a 20-year period
Overall,the amount of paper and packaging witnessed an upward trend, while reverse pattern could be seen on sawn-wood.On the other hand ,the total amount of wood-pulp production witnessed an flactuation,which decreased and then increased by the end of period
As can be seen from the chart,in 1980,the production of Paper and Packaging led the figure with approximately 250 million tonnes,which is 50 million tonnes more than Sawn-Wood.Subsequently,The figure for Paper and packaging rocketed to nearly 350 tonnes in 2000,whereas Sawn-wood production witnessed noticeable fall,hitting around 130 million tons by the end of period
In contrast,nearly 170 million tons of Wood-Pulp was manufactured,hitting the lowest point of all listed categories,after which declined slightly to 150 million tons in 1990.However,the figure made a recovery to almost 160 million tons at the end of surveyed time
Word Count: 155