Our system will evaluate the answer based on this AI-generated description.
The image displays a line graph titled "Channel one news viewing figures" with four lines representing different times: 1 pm, 6 pm, 9:30 pm, and 11 pm, tracking monthly TV news viewing figures in millions of viewers per day from January to December. The 1 pm news shows viewership starts around 3.2 million in January, peaks at nearly 4.5 million in April, and drops to about 2.8 million by December. The 6 pm news begins at approximately 4.8 million, remains relatively stable, peaking slightly above this figure around May, and ends around 4.2 million. The 9:30 pm slot starts at roughly 2.7 million, rises to a peak of around 4.2 million in May, then drops sharply to about 2.5 million by December. The 11 pm news, introduced on 1st May, starts at about 1 million, peaks at around 1.5 million in June, and drops to under 1 million by December. The graph shows seasonality in viewership patterns and a marked increase for all times around May with varying degrees of decline toward the year-end.
Given the complexity of the image, the above description may not be entirely accurate.
Skyrocket your IELTS band score by 1-2 points in under a month with our premium plan!
Note: Both the topic and the answer were created by one of our users.
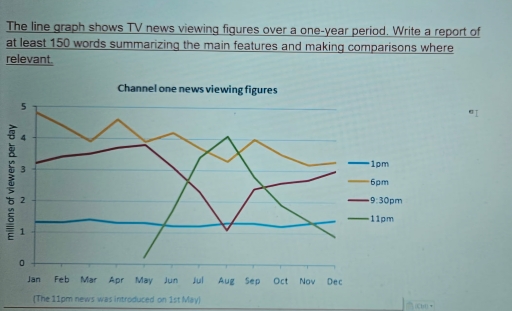
The line graph illustrates the number of viewers for four TV shows between January and December.
Overall, the 6 PM show had the highest viewership at the start, while the 1 PM show remained stable throughout the year. The 11 PM show saw the most dramatic rise, whereas other shows experienced fluctuations.
At the beginning of the year, the 6 PM show attracted the highest audience, starting at 4.8 million viewers. However, it declined sharply to 4 million by March before rising again, reaching nearly 4.7 million in April. A significant drop followed, falling to approximately 3.2 million in August. Similarly, the 9:30 PM show showed a fluctuating pattern. Starting at 3.2 million, it climbed steadily, hitting a peak of 3.7 million in May, before declining sharply to 1 million by August. It then recovered slightly, rising to 3 million by the end of the year.
In contrast, the 1 PM show remained relatively stable throughout the period, fluctuating slightly between 1 million and 1.4 million viewers. Meanwhile, the 11 PM show showed the most dramatic growth. Starting in May with just 200,000 viewers, it soared to 4 million by August, before falling back to 1 million by December.
Word Count: 199