Our system will evaluate the answer based on this AI-generated description.
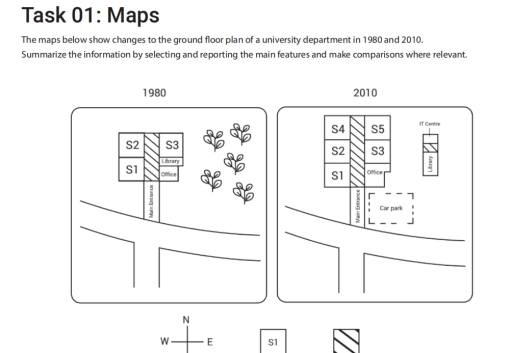
The image is a graphical representation of two floor plans for a university department, one from 1980 and the other from 2010. The 1980 map shows three seminar rooms labeled S1, S2, S3, a library, and an administrative area positioned in a cluster, with a compass indicating north at the bottom left. There is a path leading towards the administrative area, with trees alongside it. The 2010 map also displays three seminar rooms labeled S1, S2, S3, and adds two lecture rooms labeled S4, S5. The library and administrative area have been replaced by an information center, a car park has been added, and the orientation of the rooms and car park have changed. There is a compass indicating north at the bottom left, consistent with the one on the 1980 map. Side paths connect the seminar rooms to a central path. There are no numerical data points or percentages provided on either map.
Given the complexity of the image, the above description may not be entirely accurate.
Skyrocket your IELTS band score by 1-2 points in under a month with our premium plan!
Note: Both the topic and the answer were created by one of our users.
The map gives us information how the university ground floor changes from 1980 to 2010
Overall, the main changes in the university is that area of the main building expended and that natural areas was replaced by new building . Notably the car parking was built
In the main building in 2010 was built two additional room S4 and S5 . While S2 , S3 and S1 stayed with no changes . The office increase in place by occupation of library space .
Others changes in university ground floor , which placed on the surrounding area. The first one is that the natural areas with trees was destroyed to build in this place building to It center and library . The second new building is car park which placed near office .
Word Count: 132
