Our system will evaluate the answer based on this AI-generated description.
The image contains a table with data from 2005 and 2015 comparing the percentage of children with different educational problems in two primary schools, A and B. Problem areas listed include Reading ability, Handwriting, Spelling, Listening skills, Verbal expression of ideas, Concentration in lessons, and Following instructions. In 2005, School A percentages: Reading ability 22, Handwriting 28, Spelling 30, Listening skills 35, Verbal expression of ideas 35, Concentration in lessons 40, Following instructions 42. School B percentages: Reading ability 8, Handwriting 7, Spelling 5, Listening skills 11, Verbal expression of ideas 14, Concentration in lessons 15, Following instructions 6. In 2015, School A percentages: Reading ability 23, Handwriting 28, Spelling 25, Listening skills 20, Verbal expression of ideas 21, Concentration in lessons 18, Following instructions 18. School B percentages: Reading ability 9, Handwriting 7, Spelling 10, Listening skills 12, Verbal expression of ideas 15, Concentration in lessons 15, Following instructions 12.
Given the complexity of the image, the above description may not be entirely accurate.
Skyrocket your IELTS band score by 1-2 points in under a month with our premium plan!
Note: Both the topic and the answer were created by one of our users.
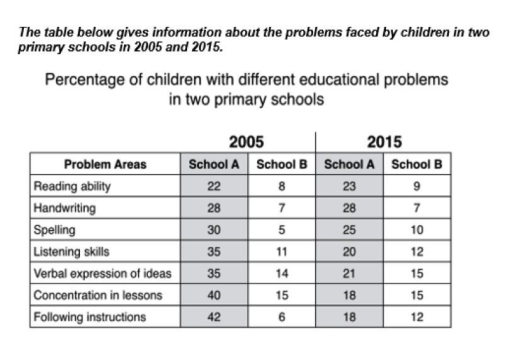
The given table represents the percentage of children with different educational problems in two primary schools in 2005 and 2015.
In general, it is apparently seen that the pupils in School A faced more educational issues when compared to School B.
In 2005, the most common issues in School A were following instructions (42%) and concentrating in lessons (40%), while only 6% and 15% of students in School B faced these difficulties, respectively. Problems with listening skills and verbal expression were also high in School A, at 35% each.
By 2015, School A had made substantial progress. The proportions of children struggling with listening skills, verbal expression, concentration, and following instructions fell dramatically, by between 14 and 24 percentage points. For instance, the percentage of pupils having trouble following instructions declined from 42% to just 18%. The only area that slightly worsened was reading ability, which rose from 22% to 23%, while handwriting remained unchanged at 28%.School B’s figures remained relatively stable, though some problem areas became slightly more common. Reading ability, spelling, and following instructions each rose by one to six percentage points. Nevertheless, even in 2015, School B’s highest figure (15% for concentration and verbal expression) was still lower than most of School A’s results.
Word Count: 207