24 Hours Only: Get 39% OFF on Our Premium Plan - Check Out Now!
Table

Band 6+: the table below gives information about the changes in the military budgets of 8 countries between 2004 and 2020

Image for topic: the table below gives information about the changes in the military budgets of 8 countries between 2004 and 2020
Our system will evaluate the answer based on this AI-generated description.
The image presents a table comparing military budgets across eight countries for years 2004 and 2020. In 2004, budgets were: United States $623bn, China $65bn, Russia $50bn, France $45bn, United Kingdom $42.8bn, Japan $41.2bn, Germany $35bn, Italy $28.2bn, totaling $930.2bn. In 2020, budgets shifted to: United States $778bn, China $178bn, Russia $61.7bn, France $48.3bn, United Kingdom $41.5bn, Japan $51.9bn, Germany $51.4bn, Italy $15bn, totaling $1,125.8bn. Germany and Japan both increased to $51.9bn and $51.4bn, respectively, while Italy displayed a decrease to $15bn from $28.2bn. Russia and France saw minor changes with Russia at $61.7bn and France at $48.3bn. The United States and China recorded the highest budgets in both years, with China rising to $178bn and the U.S. to $778bn. The total budget increased by $195.6bn from $930.2bn in 2004 to $1,125.8bn in 2020.
Given the complexity of the image, the above description may not be entirely accurate.
Note: Both the topic and the answer were created by one of our users.

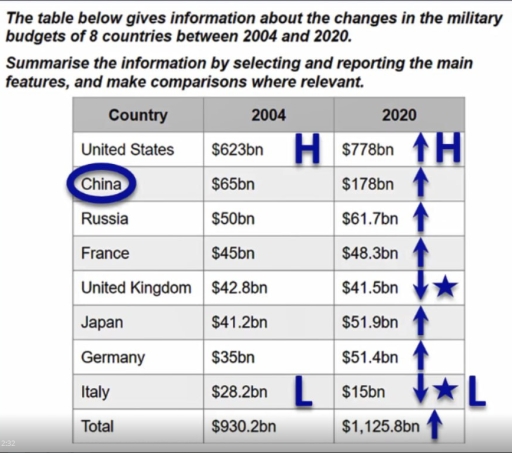
The provided table shows the amount of military budgets and its fluctuations in 8 different nations from 2004 to 2020. Overall, the USA had the highest budget throughout the period, while Italy stayed in the bottom.

Mostly, the military budgets increased between 16-years gap. The USA which had the highest budget, rose from 623 to 778 billions of US dollars. Make it the greatest increase between the 8 countries. China experienced a dramatic increase 113 billion dollars. Russia, France, Japan, Germany generally rose from 50, 45, 41.2, 35 to 61.7, 48.3, 51.9, 51.4 billion dollars respectively. In total, the differences between the two specific years was 195.6 billion dollars, rose from 930.2 to 1125.8 billion dollars.

On the other hand, there were two countries that fell gradually. The United Kingdom decreased from 42.8 to 41.5 billion dollars, while Italy who had the lowest budget, plunged from 28.2 to 15 billion dollars.

Word Count: 151

Answers On The Same Topic:

the table below gives information about the changes in the military budgets of 8 countries between 2004 and 2020

This image illustrate the milatry budget changing information of 8 countries from 2004 to 2020 in a corsoury glance there are 8 countries in this diagram and there budget as we clearly see almost every country increase their milatry budget as compare to past in 2004 in 2004 all contries have a large ammount of […]

the table below gives information about the changes in the military budgets of 8 countries between 2004 and 2020

The taple illustrates, information about the fluctuation in the military budgets of eight countries between 2004 and 2020, overall, the United States constantly witnessed the haighst statistics in both of the years 2004 and 2020, while China outperforming the other countries except the United States, in contrast Russia, France, Japan, Germany increase thier military budgets, […]

the table below gives information about the changes in the military budgets of 8 countries between 2004 and 2020

The table given above provides information on changes in military budgets in 2004 and 2020 for eight different countries. Overall, it can generally be seen that there has been a surge in the accumulated military budget for all eight countries, with the United States having the largest military budget and Italy having the smallest. Most […]

the table below gives information about the changes in the military budgets of 8 countries between 2004 and 2020

This table illustrates military investments in billion dollars among 8 different countries between 2004 and 2020. Overall, the US was always ahead of the ranking and even increased its budget, whilst Italy decreased dramatically. Moreover, China is the country that peaked the most in terms of investments, whereas the UK’s output dropped there. Not only […]

See All

Other Topics:

The table below shows the average weekly salaries of men and of women working in different occupations. Summarize the information by selecting and reporting the main features and make comparisons where relevant.

The table illustrate the average weekly salaries of male and female working in five diffrent occupations in the year 2015. Overall, according to table chart men are get higher salaries in the all filed compared to women. In the professionals flied they are get nearly equal salaries. Firstly, In the field of technicians men get […]

The graph below shows the percentage of people unemployed in the total labour workforce across 9 countries in 1994 and 2004. Summarize the information by solocting and reporting the main features, and make comparisons where relevant.

The given table displays information of the percentage of unemployed people in the total labor workforce in 9 countries for the years 1994 and 2004. Overall, the changes in the number of unemployed people vary for each country. With the one experiencing the greatest drop being Ireland. In contrast, Poland experienced the greatest rise of […]

The table below shows the average weekly salaries of men and of women working indifferent occupations

The table compares the average weekly earnings of male and female employees across five different job sectors in 2013. Overall, it is clear that men earned more than women in every occupation listed. It is also noticeable that professional roles commanded the highest salaries for both genders, while manual laborers were the lowest-paid group. In […]

The table below shows the average weekly salaries of men and of women working indifferent occupations

The table compares the average weekly earnings of male and female employees across five different job categories. Overall, it is clear that men earned more than women in every occupation listed. Additionally, both genders received the highest salaries in professional and managerial roles, while the lowest earnings were found in the service and manual sectors. […]

The table shows the total percentage of GDP spent on healthcare, with a breakdown into public and private spending in five different countries. Summarise the information by selecting and reporting the main features, and make comparisons where relevant. Write at least 150 words.

The diagram illustrates the sum proportion of GDP invested in healthcare, with an explanation to the audience and private expenditure throughout 5 territories. In essence, the chart projects that even if the numbers are similar, France had the highest shares. Meanwhile, the amount of money spent by Japan and Italy was the lowest. To start […]

The table below shows the household composition in a North American country from 1970 and 2003. Summarize information and make comparison where relevant

The table shows the contrast of composition of a household, family household and non-family household,s in percent in the years 1970 and 2003. Overall, there are no significant change in numbers between the years; however, in the family houshold composition, married couples household has had a decrease from 61% in 1970 to 41% in 2003. […]

See All
We have detected unusual activity on your device.
Please verify your identity to continue.
Note: This verification step won't sign you in. If you have a premium account, please log in to access the service as usual.
Google/Gmail Verification
Or verify using Email/Code
We've sent a verification code to:
youremail@gmail.com (Not your email?)
Enter it below to complete the verification process.
Ensure your email address is correct, your inbox is not full, and you check your spam folder. If no email arrives, consider using an alternative email.
You will need a Premium plan to perform your action!
Note: If you already have a premium account, please log in to access our services as usual.

Plans & Pricing

Our mission is to make quality education accessible and free for everyone.
However, to keep our hardworking team running and this service alive, we genuinely need your support!
By opting for a premium plan, not only do you sustain us in achieving the mission, but you also unlock advanced features to enrich your learning experience.

Free

For learners who aren't pressed for time

What's included on Free
1000+ IELTS Tests & Samples
Instant IELTS Writing Task 1 & 2 Evaluation (2 times/month)
Instant IELTS Speaking Part 1, 2, & 3 Evaluation (5 times/month)
Instant IELTS Writing Task 1 & 2 Essay Generator (2 times/month)
500+ Dictation & Shadowing Exercises
100+ Pronunciation Exercises
Flashcards
Other Advanced Tools

Premium

For those serious about advancing their English proficiency, and for IELTS candidates aspiring to boost their band score by 1-2 points (especially in writing & speaking) in just 30 days or less

What's included on Premium
Save Your IELTS Test Progress
Unlock All Courses & Content
Unlimited AI Conversations
Unlimited AI Writing Enhancement Exercises
Unlimited IELTS Writing Task 1 & 2 Evaluation
Unlimited IELTS Speaking Part 1, 2, & 3 Evaluation
Checked Answers Will Not Be Published
Unlimited IELTS Writing Task 1 & 2 Essay Generator
Unlimited IELTS Speaking Part 1, 2, & 3 Sample Generator
Unlimited Usage Of Advanced Tools

Due to the nature of our service and the provided free trials, payments are non-refundable.
Nếu bạn là người Việt Nam và không có hoặc không muốn trả bằng credit/debit cards, bạn có thể thanh toán bằng phương thức chuyển khoản:


Chọn gói:
279,000₫ 157,000 ₫ cho gói 1 tháng (chỉ 5,233₫/ngày)
819,000₫ 397,000 ₫ cho gói 3 tháng (chỉ 4,411₫/ngày)
1,649,000₫ 667,000 ₫ cho gói 6 tháng (chỉ 3,706₫/ngày)
3,299,000₫ 857,000 ₫ cho gói 12 tháng (chỉ 2,381₫/ngày)


Sau khi chuyển khoản, vui lòng đợi trình duyệt tự động điều hướng bạn trở lại Engnovate và bạn sẽ ngay lập tức nhận được mã kích hoạt tài khoản premium.
Nếu có lỗi xảy ra, bạn có thể liên hệ với team thông qua một trong các phương thức: email đến helloengnovate@gmail.com hoặc nhắn tin qua facebook.com/engnovate.
Vì toàn bộ công cụ trên website đều có thể sử dụng thử miễn phí, Engnovate không hỗ trợ hoàn tiền.