🔥 Today Only: Save 30% on Premium — Offer Ends Soon! - Upgrade Now!
Table

Band 8+: The table below gives information about the problems faced by children in two primary schools in 2005 and 2015.

Image for topic: The table below gives information about the problems faced by children in two primary schools in 2005 and 2015.
Our system will evaluate the answer based on this AI-generated description.
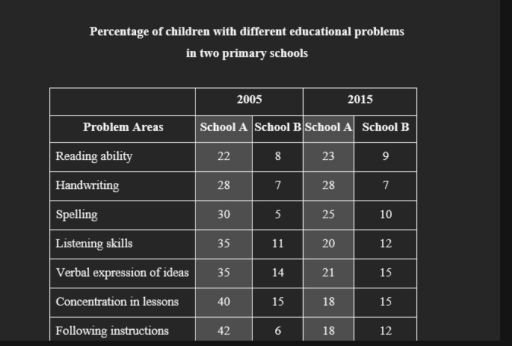
The image presents a table with data on the percentage of children with different educational problems in two primary schools across two years, 2005 and 2015. Problem areas are divided into Reading ability, Handwriting, Spelling, Listening skills, Verbal expression of ideas, Concentration in lessons, and Following instructions. School A in 2005 shows 22% in Reading ability, 28% in Handwriting, 30% in Spelling, 35% in Listening skills, 35% in Verbal expression of ideas, 40% in Concentration in lessons, and 42% in Following instructions. School B in 2005 shows 8% in Reading ability, 7% in Handwriting, 5% in Spelling, 11% in Listening skills, 14% in Verbal expression of ideas, 15% in Concentration in lessons, and 6% in Following instructions. In 2015, School A percentages are 23% in Reading ability, 28% in Handwriting, 25% in Spelling, 20% in Listening skills, 21% in Verbal expression of ideas, 18% in Concentration in lessons, and 18% in Following instructions. In 2015, School B percentages are 9% in Reading ability, 7% in Handwriting, 10% in Spelling, 12% in Listening skills, 15% in Verbal expression of ideas, 15% in Concentration in lessons, and 12% in Following instructions.
Given the complexity of the image, the above description may not be entirely accurate.
Note: Both the topic and the answer were created by one of our users.

The table compares the percentages of students in two elementary schools suffering from seven educational problems in 2005 and 2015.

Overall, over ten years, the impact of most educational issues on students in school A alleviated, except for reading ability and handwriting, while the severity of every educational problem was exacerbated for school B. Nevertheless, students in school A remained more prone to such difficulties.

Regarding school A, the percentages of students with reading ability or handwriting were not alleviated, with the former slightly rising from 22% to 23%, while the latter remaining at 28%. In contrast, verbal expression of ideas, concentration in lessons, and following instructions significantly alleviated in degree: while all affected roughly 40% of school A’s students in 2005, this number was off by just 20% afterward.

Meanwhile, schools B reported noticeably lower percentages. The proportion of students with educational difficulties in this school was meager, ranging from 6% to 15% in two years. However, most problems rose in degree, with spelling and following instructions even doubling in percentages, while the increases exhibited by the remaining problems were slighter.

Word Count: 182

Answers On The Same Topic:

The table below gives information about the problems faced by children in two primary schools in 2005 and 2015.

The table presents the percentage of children experiencing various educational difficulties in two primary schools in 2005 and 2015. Overall, School A had a significantly higher percentage of students struggling with educational issues compared to School B in both years. However, while School A saw a noticeable improvement across all problem areas over the decade, […]

The table below gives information about the problems faced by children in two primary schools in 2005 and 2015.

The table illustrates the percentages of children experiencing various educational difficulties in two primary schools (School A and School B) in 2005 and 2015. Overall, School A saw a significant decline in the proportion of children facing educational problems over the decade, whereas School B experienced a slight increase in most categories. The most common […]

The table below gives information about the problems faced by children in two primary schools in 2005 and 2015.

The table provides data about the proportions of students facing numerous educational obstacles in two primary schools, namely school A and school B, during the years 2005 and 2015. Overall, significant reductions in the percentages of students with learning difficulties was witnessed in school A, while the reverse was true for school B. In school […]

The table below gives information about the problems faced by children in two primary schools in 2005 and 2015.

The table illustrates the proportions of students at two primary schools who faced seven distinct educational challenges in 2005 and 2015. To sum up, School A had a larger share of children experiencing all seven educational challenges in both years. In addition, while School A reduced the number of most issues from 2005 to 2015, […]

See All

Other Topics:

The chart below shows the primary hobbies of the adult residents in a small Tunisian town. Summarise the information by selecting and reporting the main features, and make comparisons where relevant.

The table compares the main hobbies of the adult inhabitants in a small Tunisian town throughout-40 years. Overall, the figure for TV and movies was the highest, whereas that for video games was the lowest at the end of this period. Moreover, the figures for TV and movies, book, and working out experienced an upward […]

The table below gives information on consumer spending on different items in five different countries in 2002. Summarize the information by selecting and reporting the main features, and make comparisons where relevant.

The table displays the percentages of consumer expenditure of five European countries according to three distinct categories in 2002. Overall, in all the five countries, Turkey held the highest figures for two categories, food/drinks/tobacco and leisure/education that were the largest and almost proportion’s respectively among the five countries shown. And for the rest category, clothing/footwear, […]

The table below gives information about the percantage of households with different types of technology in three countries in 2020

The table shows the percentage of households owning five types of technology in the USA, the UK and Japan in 2020. Overall, internet access and smartphone ownership were the most widespread forms of technology in all three countries, while ownership of tablets, smart TVs and desktop computers varied more significantly and was generally lower. Starting […]

The table describes the changes of people who went for international travel in 1990, 1995, 2000 and 2005. Summarise the information by selecting and reporting the main features and make comparisons where relevant.

The table compares the number of citizens who went for travel abroad acroos five countries between 1990 to 2005. the data has been measured in millions. Overall, in brief the data reveals the upward trend of people who visits the countires. Europe shows huge number of travellers whereas Middle East shows lowest in the trend. […]

Topic: Percentage of the population living in cities (Urbanization) in four countries.

The given table illustrates the data on the proportion of people residing in urban areas in four different nations in 1970 and 1990, which is represented in percentage. Overall, highest number of people in UAE are seen to reside in the city in both years and lowest number is contributed by India. Major urbanization was […]

The three pie charts below show changes in annual spending at a public school in Canada in 1990, 2000, and 2010. Summarise the information by selecting and reporting the main features, and make comparisons where relevant.

The three pie charts given below illustrates the changes in annual expenditure at a government school in Canada in 1990, 2000, and 2010. Overall, total spending in all three year remained almost similar. Teacher’s salary was the highest paid while, technology seems to have the least spending in two years but in 2010 that increased […]

See All
We have detected unusual activity on your device.
Please verify your identity to continue.
Note: This verification step won't sign you in. If you have a premium account, please log in to access the service as usual.
Google/Gmail Verification
Or verify using Email/Code
We've sent a verification code to:
youremail@gmail.com (Not your email?)
Enter it below to complete the verification process.
Ensure your email address is correct, your inbox is not full, and you check your spam folder. If no email arrives, consider using an alternative email.
You will need a Premium plan to perform your action!
Note: If you already have a premium account, please log in to access our services as usual.

Plans & Pricing

Our mission is to make quality education accessible for everyone.
However, to keep our hardworking team running and this service alive, we genuinely need your support!
By opting for a premium plan, not only do you sustain us in achieving the mission, but you also unlock advanced features to enrich your learning experience.

Free

For learners who aren't pressed for time

What's included on Free
100+ Cambridge IELTS Tests
Instant IELTS Writing Task 1 & 2 Evaluation (2 times/month)
Instant IELTS Speaking Part 1, 2, & 3 Evaluation (2 times/month)
Instant IELTS Writing Task 1 & 2 Essay Generator (2 times/month)
500+ Dictation & Shadowing Exercises
100+ Pronunciation Exercises
Flashcards
Other Advanced Tools

Premium

For those serious about advancing their English proficiency, and for IELTS candidates aspiring to boost their band score by 1-2 points (especially in writing & speaking) in just 30 days or less

What's included on Premium
Save Your IELTS Test Progress & Analyze Mistakes By Question Type
Save Your Own Flashcard Sets & Use Them On Any Device
Unlock All Courses, IELTS Tests, Section & Part Practice
Unlimited AI Conversations
Unlimited AI Writing Enhancement Exercises
Unlimited IELTS Writing Task 1 & 2 Evaluation
Unlimited IELTS Speaking Part 1, 2, & 3 Evaluation
Checked Answers Will Not Be Published
Unlimited IELTS Writing Task 1 & 2 Essay Generator
Unlimited IELTS Speaking Part 1, 2, & 3 Sample Generator
Unlimited Usage Of Advanced Tools & AI Features
Priority Support within 24h (12-month plan only)

Due to the nature of our service and the provided free trials, payments are non-refundable.