🔥 Today Only: Save 30% on Premium — Offer Ends Soon! - Upgrade Now!
Table

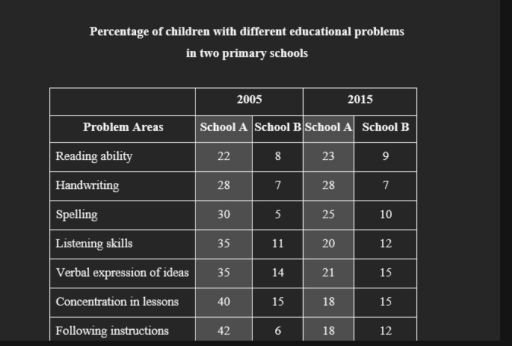
Band 9: The table below gives information about the problems faced by children in two primary schools in 2005 and 2015.

Image for topic: The table below gives information about the problems faced by children in two primary schools in 2005 and 2015.
Our system will evaluate the answer based on this AI-generated description.
The image presents a table with data on the percentage of children with different educational problems in two primary schools across two years, 2005 and 2015. Problem areas are divided into Reading ability, Handwriting, Spelling, Listening skills, Verbal expression of ideas, Concentration in lessons, and Following instructions. School A in 2005 shows 22% in Reading ability, 28% in Handwriting, 30% in Spelling, 35% in Listening skills, 35% in Verbal expression of ideas, 40% in Concentration in lessons, and 42% in Following instructions. School B in 2005 shows 8% in Reading ability, 7% in Handwriting, 5% in Spelling, 11% in Listening skills, 14% in Verbal expression of ideas, 15% in Concentration in lessons, and 6% in Following instructions. In 2015, School A percentages are 23% in Reading ability, 28% in Handwriting, 25% in Spelling, 20% in Listening skills, 21% in Verbal expression of ideas, 18% in Concentration in lessons, and 18% in Following instructions. In 2015, School B percentages are 9% in Reading ability, 7% in Handwriting, 10% in Spelling, 12% in Listening skills, 15% in Verbal expression of ideas, 15% in Concentration in lessons, and 12% in Following instructions.
Given the complexity of the image, the above description may not be entirely accurate.
Note: Both the topic and the answer were created by one of our users.

The table presents the percentage of children experiencing various educational difficulties in two primary schools in 2005 and 2015.

Overall, School A had a significantly higher percentage of students struggling with educational issues compared to School B in both years. However, while School A saw a noticeable improvement across all problem areas over the decade, School B experienced a slight increase in difficulties.

In 2005, the most prevalent issues in School A were following instructions (42%), concentration in lessons (40%), and verbal expression of ideas (35%). However, by 2015, these figures had dropped significantly to 18%, 18%, and 21%, respectively. Similarly, listening skills, which affected 35% of students in 2005, declined to 20% in 2015. Although handwriting remained unchanged at 28%, spelling difficulties decreased from 30% to 25%.

Conversely, School B had far fewer students facing educational challenges, with the highest recorded issue in 2005 being concentration in lessons at 15%. By 2015, this figure rose slightly to 15%, alongside small increases in reading ability (from 8% to 9%), spelling (from 5% to 10%), listening skills (from 11% to 12%), and following instructions (from 6% to 12%). Handwriting, however, remained stable at 7%.

In summary, School A showed a significant reduction in learning difficulties over the years, while School B saw minor increases in some areas but still maintained much lower rates of educational challenges.

Word Count: 225

Answers On The Same Topic:

The table below gives information about the problems faced by children in two primary schools in 2005 and 2015.

The table illustrates the percentages of children experiencing various educational difficulties in two primary schools (School A and School B) in 2005 and 2015. Overall, School A saw a significant decline in the proportion of children facing educational problems over the decade, whereas School B experienced a slight increase in most categories. The most common […]

The table below gives information about the problems faced by children in two primary schools in 2005 and 2015.

The table provides data about the proportions of students facing numerous educational obstacles in two primary schools, namely school A and school B, during the years 2005 and 2015. Overall, significant reductions in the percentages of students with learning difficulties was witnessed in school A, while the reverse was true for school B. In school […]

The table below gives information about the problems faced by children in two primary schools in 2005 and 2015.

The table compares the percentages of students in two elementary schools suffering from seven educational problems in 2005 and 2015. Overall, over ten years, the impact of most educational issues on students in school A alleviated, except for reading ability and handwriting, while the severity of every educational problem was exacerbated for school B. Nevertheless, […]

The table below gives information about the problems faced by children in two primary schools in 2005 and 2015.

The table illustrates the proportions of students at two primary schools who faced seven distinct educational challenges in 2005 and 2015. To sum up, School A had a larger share of children experiencing all seven educational challenges in both years. In addition, while School A reduced the number of most issues from 2005 to 2015, […]

See All

Other Topics:

the table below gives information about the changes in the military budgets of 8 countries between 2004 and 2020

The table shows how much money were in military budgets in eight different countries in 2004 and 2020. In general, almost all country budgets trended upwards, the only nations which bucked down were the United Kingdom and Italy. It is worth mentioning that, the United States stood out with the highest amount of money while […]

The table shows the number of international students from five different countries who enrolled in a university in the UK in 2018 and 2022.

The table provides information about the number of students from five countries who enrolled at a UK university in 2018 and 2022 Overall,the number of students from most countries increased in 2022 compared with 2018.The biggest number of international students came from China in both years,while the number of students from Brazil was the lowest. […]

The table below shows the percentage of people in four age groups who used three types of social media in a country in 2010 and 2025.

The table illustrates the percentage of people in four different age groups who used three types of social media in a certain country over a 15-year period. Overall, people aged 18-24 recorded the highest proportion of social networking users in 2025, while people aged 50 and over showed the slowest percentage of professional networking in […]

The table below presents the food consumption per weekly in aEuropean country in 1992, 2002 and 2012.

The table illustrates the weekly consumption of five types of food, namely vegetables, meat, wheat, beans and cheese, per person in a European country in 1992, 2002 and 2012. Overall, vegetables were by far the most widely consumed food throughout the period, whereas cheese had the lowest figures. The consumption of vegetables, wheat and beans […]

The table below shows the consumption of three basic foods (wheat, maize, rice) by people in four different countries.

The table compares the consumption of three basic foods, which are wheat, maize and rice, by people, measured in calories per person per day, in four different countries. Overall, it is clear that the highest consumption of wheat was recorded at both Poland and Egypt. However, in Cambodia the consumption of rice was the dominant […]

The table shows questionnaires about the opinions of club members and general public for the new theater in one town in 2012.

The table shows opinions about new theater questioned by club members and general public in 2012. Overall, club members gave more positive ratings for facilities and quality, whereas the general public rated information more favourably. Quality recieved the lowest proportion of poor ratings, while information had the highest figure of people who choosed it to […]

See All
We have detected unusual activity on your device.
Please verify your identity to continue.
Note: This verification step won't sign you in. If you have a premium account, please log in to access the service as usual.
Google/Gmail Verification
Or verify using Email/Code
We've sent a verification code to:
youremail@gmail.com (Not your email?)
Enter it below to complete the verification process.
Ensure your email address is correct, your inbox is not full, and you check your spam folder. If no email arrives, consider using an alternative email.
You will need a Premium plan to perform your action!
Note: If you already have a premium account, please log in to access our services as usual.

Plans & Pricing

Our mission is to make quality education accessible for everyone.
However, to keep our hardworking team running and this service alive, we genuinely need your support!
By opting for a premium plan, not only do you sustain us in achieving the mission, but you also unlock advanced features to enrich your learning experience.

Free

For learners who aren't pressed for time

What's included on Free
100+ Cambridge IELTS Tests
Instant IELTS Writing Task 1 & 2 Evaluation (2 times/month)
Instant IELTS Speaking Part 1, 2, & 3 Evaluation (2 times/month)
Instant IELTS Writing Task 1 & 2 Essay Generator (2 times/month)
500+ Dictation & Shadowing Exercises
100+ Pronunciation Exercises
Flashcards
Other Advanced Tools

Premium

For those serious about advancing their English proficiency, and for IELTS candidates aspiring to boost their band score by 1-2 points (especially in writing & speaking) in just 30 days or less

What's included on Premium
Save Your IELTS Test Progress & Analyze Mistakes By Question Type
Save Your Own Flashcard Sets & Use Them On Any Device
Unlock All Courses, IELTS Tests, Section & Part Practice
Unlimited AI Conversations
Unlimited AI Writing Enhancement Exercises
Unlimited IELTS Writing Task 1 & 2 Evaluation
Unlimited IELTS Speaking Part 1, 2, & 3 Evaluation
Checked Answers Will Not Be Published
Unlimited IELTS Writing Task 1 & 2 Essay Generator
Unlimited IELTS Speaking Part 1, 2, & 3 Sample Generator
Unlimited Usage Of Advanced Tools & AI Features
Priority Support within 24h (12-month plan only)

Due to the nature of our service and the provided free trials, payments are non-refundable.