Our system will evaluate the answer based on this AI-generated description.
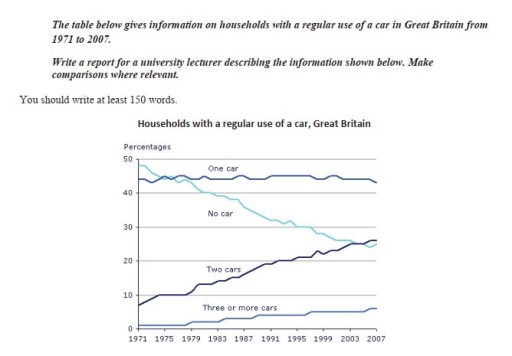
The image shows a graph of households in Great Britain with regular use of a car from 1971 to 2007. In 1971: One car: ~48%, No car: ~43%, Two cars: ~8%, Three or more cars: ~2%. In 1975: One car: ~46%, No car: ~40%, Two cars: ~11%, Three or more cars: ~2%. In 1979: One car: ~43%, No car: ~34%, Two cars: ~18%, Three or more cars: ~2%. In 1983: One car: ~42%, No car: ~30%, Two cars: ~23%, Three or more cars: ~3%. In 1987: One car: ~45%, No car: ~27%, Two cars: ~25%, Three or more cars: ~3%. In 1991: One car: ~44%, No car: ~27%, Two cars: ~26%, Three or more cars: ~3%. In 1995: One car: ~43%, No car: ~29%, Two cars: ~28%, Three or more cars: ~3%. In 1999: One car: ~44%, No car: ~28%, Two cars: ~28%, Three or more cars: ~4%. In 2003: One car: ~44%, No car: ~28%, Two cars: ~28%, Three or more cars: ~5%. In 2007: One car: ~43%, No car: ~25%, Two cars: ~28%, Three or more cars: ~6%.
Given the complexity of the image, the above description may not be entirely accurate.
Skyrocket your IELTS band score by 1-2 points in under a month with our premium plan!
Note: Both the topic and the answer were created by one of our users.
The line graph depicts the number of residents’ vehicle, they regularly use in the UK, throughout the year of 1971 to 2007.
Overall, it is evident that number of individuals, who have one car, is relatively hovering around one indication. Meanwhile, the proportion of people, possessing two and up to three cars, saw increase during the given period. Conversely, the percentage of no car significantly declined.
The number of citizens with no car commenced the period as a second leading trend with 45%. It was fluctuating around this proportion throughout the period and ended up as a dominant trend, at approximately 44%, by 2007. Meanwhile, proportion of people having up to three cars slightly went up from 2% (in 1997) to 8% (in 2007).
Poeple with couple of transport started the period with, roughly 8%, in 1997. By 2007, theese numbers rapidly increased, reaching 26%. This trend surpassed the number of “no car”, regarding this, in 2007, become the second leading trend. The ultimate trend, “no car” was the first leading proprotion standing at 50% in 1997. Throughout the period this trend experienced a significant drop, dramatically falling to 25%, by 2007 and beaten by “one car” and “two cars”.
Word Count: 200
