Our system will evaluate the answer based on this AI-generated description.
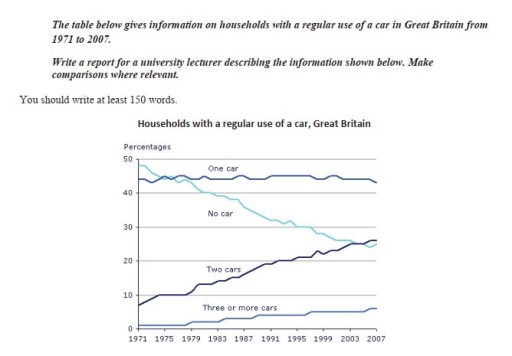
The image shows a graph of households in Great Britain with regular use of a car from 1971 to 2007. In 1971: One car: ~48%, No car: ~43%, Two cars: ~8%, Three or more cars: ~2%. In 1975: One car: ~46%, No car: ~40%, Two cars: ~11%, Three or more cars: ~2%. In 1979: One car: ~43%, No car: ~34%, Two cars: ~18%, Three or more cars: ~2%. In 1983: One car: ~42%, No car: ~30%, Two cars: ~23%, Three or more cars: ~3%. In 1987: One car: ~45%, No car: ~27%, Two cars: ~25%, Three or more cars: ~3%. In 1991: One car: ~44%, No car: ~27%, Two cars: ~26%, Three or more cars: ~3%. In 1995: One car: ~43%, No car: ~29%, Two cars: ~28%, Three or more cars: ~3%. In 1999: One car: ~44%, No car: ~28%, Two cars: ~28%, Three or more cars: ~4%. In 2003: One car: ~44%, No car: ~28%, Two cars: ~28%, Three or more cars: ~5%. In 2007: One car: ~43%, No car: ~25%, Two cars: ~28%, Three or more cars: ~6%.
Given the complexity of the image, the above description may not be entirely accurate.
Skyrocket your IELTS band score by 1-2 points in under a month with our premium plan!
Note: Both the topic and the answer were created by one of our users.
The line graph gives information about the rate of households with the regular use of a car (one car, No car, two cars, three or more cars) in Great Britain. between 1971 and 2007.
Overall, according to the graph, the rate of households using of two cars and three or more cars followed an upward trend, while the figure for one car and no car experienced a downward trend over the period.
Looking at the graph we can see that the rate of three or more cars owners experienced an increase to about 10% in 1991 before growing significantly to 10% in 2007. There was a stable trend in the percentage of households with one car at around 44% in 1971, followed by minor fluctuations over the next three decades.
It can be seen from the line graph, the rate of households with the regular use of No car decreased significantly from 50% to about 40% between 1971 and 1987, then registered a dramatic reduce between 1991 and 2007. The figure for households two cars climb to 25% in 2003 after undergoing an increase to 20% in 1991. The rate of households with two cars went through a period of dramatic increase to 25% in 2003, exceeding the rate of no cars, which had 20%.
Word Count: 215
