🔥 Today Only: Save 30% on Premium — Offer Ends Soon! - Upgrade Now!
Table

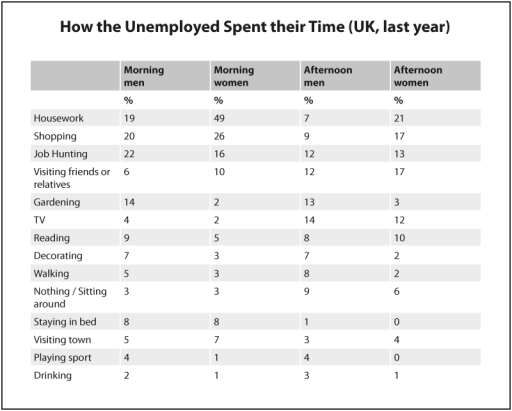
Band 4+: The table below shows how the UK unemployed spent their time last year. Summarise the information by selecting and reporting the main features, and make comparisons where relevant.

Image for topic: The table below shows how the UK unemployed spent their time last year. Summarise the information by selecting and reporting the main features, and make comparisons where relevant.
Our system will evaluate the answer based on this AI-generated description.
The image shows a chart of how unemployed individuals in the UK spent their time last year, divided into morning and afternoon activities for both men and women. Housework was the most common activity for women in the morning (49) and afternoon (21), while job hunting was the highest for men in the morning (22) and afternoon (12). Women also spent significant time visiting friends or relatives in the afternoon (17). Gardening was more common in the afternoon for both men (13) and women (3). Morning reading was slightly higher for men (9) than women (5), but the opposite was true in the afternoon with women at 10 and men at 8. Walking was more common in the afternoon for men (8) than women (2). Both men and women spent equal time staying in bed in the morning (8), but only men stayed in bed in the afternoon (1). Playing sports and drinking were the least common activities, with both being slightly higher in the afternoon for men (4).
Given the complexity of the image, the above description may not be entirely accurate.
Note: Both the topic and the answer were created by one of our users.

The table compares how many work individuals in United Kingdom were spent their time last year.

Overall,it is clear that housework,hunting and shopping were extremely popular in different sessions and among other genders such men and women rather than any leisure activities.

The first activity called housework had more proportions with the total of 49% in morning among females.In addition,housework was also dominant in afternoon women session.However,shopping was popular among females in morning with 26% and 20% in morning among men.Nevertheless,job hunting was leading by males with total of 22% in morning compared with females who had only 16% at that time.Admittedly,visiting friends and relatives was also dominated by women with 17% in afternoon session while men had extremely low proportion.

Moreover,other activities such as gardening,tv and reading had equal numbers at about 15% among genders altogether.In addition,decorating and walking were also popular among males with total of 10% respectively while other activities were always led by men last year.

Word Count: 160

Answers On The Same Topic:

The table below shows how the UK unemployed spent their time last year. Summarise the information by selecting and reporting the main features, and make comparisons where relevant.

The table illustrates the activities undertaken by unemployed individuals in the UK during their free time last year, divided into percentages for men and women. Overall, both men and women spent the majority of their time on home-based activities, although there were noticeable differences in how each gender allocated their time. Men were more engaged […]

The table below shows how the UK unemployed spent their time last year. Summarise the information by selecting and reporting the main features, and make comparisons where relevant.

The table presents a detailed account of how unemployed individuals in the UK allocated their time during the previous year, categorizing activities by both gender and time of day. A clear trend emerges indicating that indoor activities, particularly housework for women and job hunting for men, dominated the daily schedules of the unemployed. Conversely, recreational […]

The table below shows how the UK unemployed spent their time last year. Summarise the information by selecting and reporting the main features, and make comparisons where relevant.

The table illustrates how the unemployed population in the UK allocated their time across various activities over the past year. Notably, housework emerged as the predominant activity for women, while men predominantly engaged in job hunting. Both genders exhibited minimal participation in sports and drinking. In the morning, a significant majority of women, accounting for […]

The table below shows how the UK unemployed spent their time last year. Summarise the information by selecting and reporting the main features, and make comparisons where relevant.

The table delineates the activities undertaken by unemployed individuals in the United Kingdom over the previous year, segmented by gender and varying time slots throughout the day. Overall, the data underscores significant gender disparities in how unemployed individuals allocate their time, particularly in housework and job hunting activities. In the morning, housework emerged as the […]

The table below shows how the UK unemployed spent their time last year. Summarise the information by selecting and reporting the main features, and make comparisons where relevant.

The table shows how men and women who were out of work last year spent their time. The information is broken down into parts of the day and fourteen different activities. First of all, it is interesting to note that the majority of both men and women who are unemployed are engaged in productive activities […]

See All

Other Topics:

The table below shows the causes of injuries in Australia for teenagers and the general population. Summarize the information by selecting and reporting the main features, making comparisons where relevant.

The table demonstrates teenagers’ and the total population’s injury causes in Australia. In general, males had the highest number of injuries in both total transport accidents and in other different types of medical injuries, which leads to the highest number in all cases, among all other groups excluding total population number. to begin with males […]

the table show the percentage of land area covered by forest in 7 countries in 1990 and 2000

The table illustrates the proportion of land area covered by forests in seven countries . It is evident that Suriname is the country which covered the highest proportion of land approximately 95% in both years and followed by Brazil which was amounted 65% in 1990 and 62% in 2000. Wheareas, the land least covered by […]

Task 1: The table below gives information on the number of Australian people who visited the seven most popular destinations in 1999 and 2009. Provide an overview of the information by identifying and describing the key details, and include comparisons where appropriate.

The data illustrate about the most vital choice for the Australians to travel among several countires such as China, Japan, US, UK, etc between year of 1999 and 2009. Overall, New zealand stays the top of the option for travellers followed by UK and US. The least destionations are Fiji and Japan. Others hold quite […]

The table shows spending on consumer goods in Germany and Italy i. 2010 (in pounds)

The given data illustrates the information on the amount of money people in two European countries spent on buying materialistic things in 2010. The information is given in pounds. Overall, residents of both Germany and Italy spent most of their earnings on car. Least amont of spending was allocated for perfume in Germany while for […]

The table shows the changes in modes of travel in a European country between 1995 and 2025. It also shows a projection to the year 2015

The provided table illustrated the differences in trends of travel in a European country between 1995 and 2005, and expectation to the year 2025. As an overall statement, it is apparent that bus experienced the highest choice in modes of journeys, whereas bicycle was the lowest option of transportation type to travel. According to the […]

Describe the information shown below in your own words. What implications do the indicators have for the countries.

the table show the amount of money spent on four different items in four country during the year 1994. overall, the amount of money highest expend on annual income per person in japan, while the lowest money spent on adult literacy rate in zaire in the given year. In terms of figures, in japan per […]

See All
We have detected unusual activity on your device.
Please verify your identity to continue.
Note: This verification step won't sign you in. If you have a premium account, please log in to access the service as usual.
Google/Gmail Verification
Or verify using Email/Code
We've sent a verification code to:
youremail@gmail.com (Not your email?)
Enter it below to complete the verification process.
Ensure your email address is correct, your inbox is not full, and you check your spam folder. If no email arrives, consider using an alternative email.
You will need a Premium plan to perform your action!
Note: If you already have a premium account, please log in to access our services as usual.

Plans & Pricing

Our mission is to make quality education accessible for everyone.
However, to keep our hardworking team running and this service alive, we genuinely need your support!
By opting for a premium plan, not only do you sustain us in achieving the mission, but you also unlock advanced features to enrich your learning experience.

Free

For learners who aren't pressed for time

What's included on Free
100+ Cambridge IELTS Tests
Instant IELTS Writing Task 1 & 2 Evaluation (2 times/month)
Instant IELTS Speaking Part 1, 2, & 3 Evaluation (2 times/month)
Instant IELTS Writing Task 1 & 2 Essay Generator (2 times/month)
500+ Dictation & Shadowing Exercises
100+ Pronunciation Exercises
Flashcards
Other Advanced Tools

Premium

For those serious about advancing their English proficiency, and for IELTS candidates aspiring to boost their band score by 1-2 points (especially in writing & speaking) in just 30 days or less

What's included on Premium
Save Your IELTS Test Progress & Analyze Mistakes By Question Type
Save Your Own Flashcard Sets & Use Them On Any Device
Unlock All Courses, IELTS Tests, Section & Part Practice
Unlimited AI Conversations
Unlimited AI Writing Enhancement Exercises
Unlimited IELTS Writing Task 1 & 2 Evaluation
Unlimited IELTS Speaking Part 1, 2, & 3 Evaluation
Checked Answers Will Not Be Published
Unlimited IELTS Writing Task 1 & 2 Essay Generator
Unlimited IELTS Speaking Part 1, 2, & 3 Sample Generator
Unlimited Usage Of Advanced Tools & AI Features
Priority Support within 24h (12-month plan only)

Due to the nature of our service and the provided free trials, payments are non-refundable.